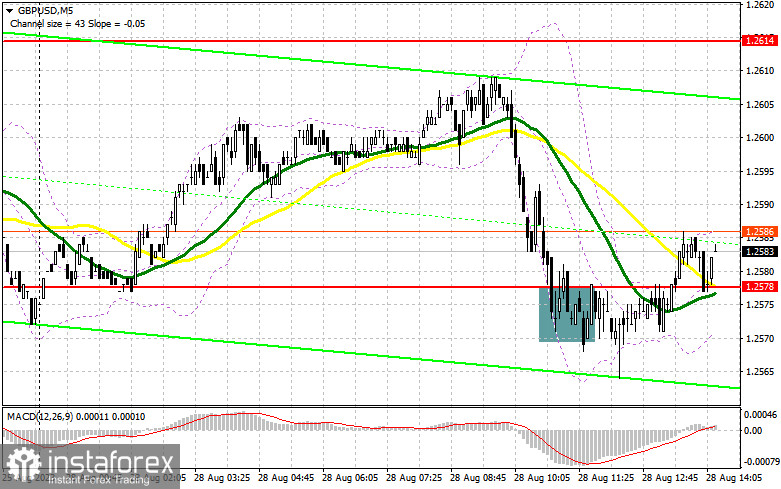
In the previous forecast, I drew your attention to the level of 1.2578 and recommended entering the market from it. Let's have a look at the 5-minute chart and analyze the situation. The pair dropped and showed a false breakout at this level, creating an entry point for long positions. However, as you can see on the chart, the British pound has failed to recover. The technical picture was reassessed for the latter half of the day.
Long positions on GBP/USD:
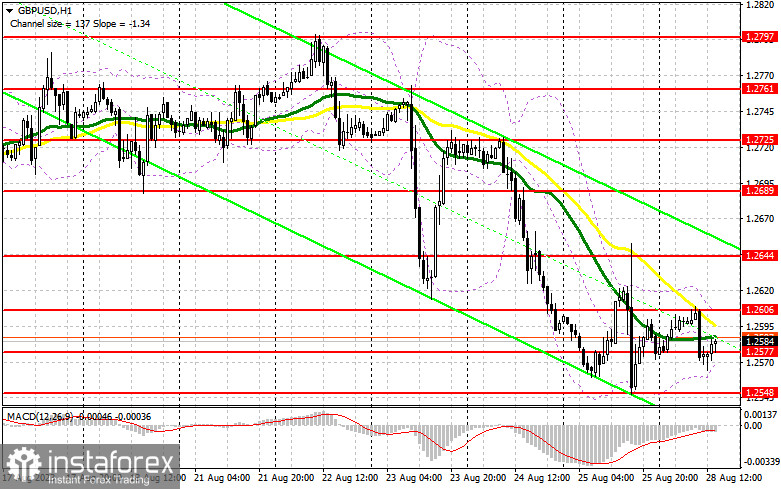
Given the complete lack of US statistics, it is unlikely that witness much during the US session. I plan to act only after a drop and the formation of a false breakout near the new support at 1.2577, established following the European session. This will provide a modest entry point aiming for a rise towards the resistance at 1.2606. A breakthrough and a test of this level may generate an additional buy signal, rejuvenating the pound and potentially propelling it to 1.2644. If there is an upward move below this level, we can consider a push towards 1.2689, where traders may lock in profits. If the pound/dollar pair declines and we see a lack of activity from bulls at 1.2577, which is also likely, pressure on the pair is likely to return, leading to another sell-off towards the monthly low. If that occurs, it would be better to postpone long positions until the pair reaches 1.2548, opening longs on a false breakout. Opening long positions on a rebound is possible from 1.2523, allowing an intraday correction of 30-35 pips.
Short positions on GBP/USD:
Bears attempted to drag the pair down but failed. For this reason, it is better to wait for a false breakout near the resistance at 1.2606, which forms a selling signal, anticipating further decline and a test of the new support at 1.2577, just above where the moving averages are located. A breakthrough and a reverse test from below within this range will provide a selling entry point, confirming the drop to 1.2548 and reinforcing bears' positions in the market. The next target will be in the area around 1.2523, where traders can take profits. If the pair grows and we see a lack of bearish activity at 1.2606, bulls may return to the market. In such a case, only a false breakout near the next resistance at 1.2644 will form an entry point for short positions. If there is no activity there either, it is better to sell the British pound from 1.2689, allowing a downward intraday correction of 30-35 pips.

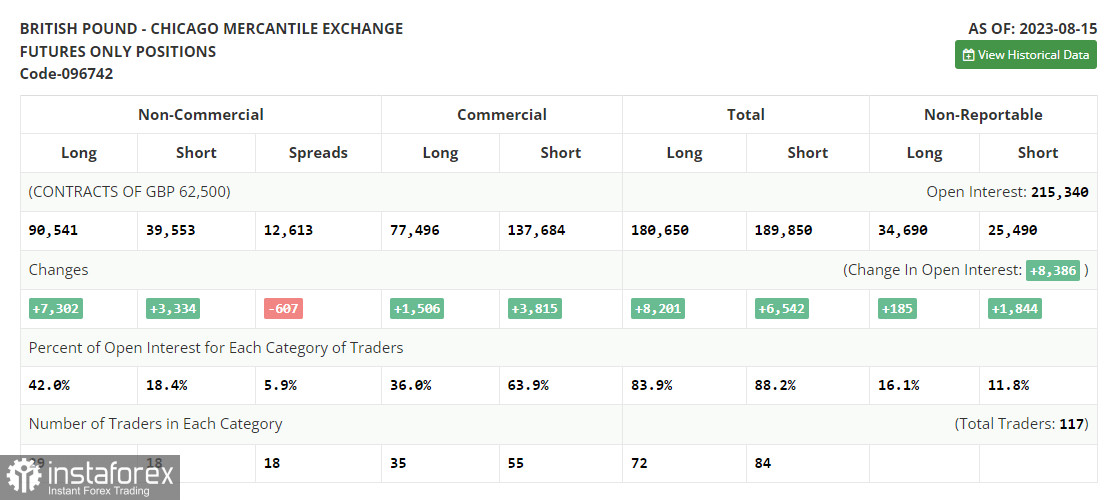
The COT report for August 15 logged growth in both long and short positions. Traders increased positions after the UK GDP data, which surpassed economists' expectations. Price decreases in the US also supported the pound, alongside strong underlying pressure in the UK. The upcoming Jackson Hole Symposium this week could further strengthen the British pound in the short term. Crucial will be what Fed Chair Jerome Powell states about the future US monetary policy. As before, the optimal strategy remains to buy the pound on dips, as central bank policy differences will impact the prospects of the US dollar, exerting pressure on it. The latest COT report states that non-commercial long positions rose by 7,302 to 90,541, while non-commercial short positions increased by 3,334 to 39,553. The spread between long and short positions narrowed by 607. The weekly price dropped to 1.2708 from 1.2749.

Signals of indicators:
Moving Averages:
The pair is trading near the 30- and 50-day moving averages, signaling a sideways market trend.
Note: The author considers the period and prices of the moving averages on the hourly H1 chart, which differs from the general definition of classical daily moving averages on the daily D1 chart.
Bollinger Bands:
In the case of a decrease, the lower boundary of the indicator around 1.2565 will act as support.
Descriptions of indicators:
- Moving average defines the current trend by smoothing volatility and noise. Period 50. Marked in yellow on the chart.
- Moving average defines the current trend by smoothing volatility and noise. Period 30. Marked in green on the chart.
- MACD indicator (Moving Average Convergence/Divergence). Fast EMA 12. Slow EMA 26. SMA 9.
- Bollinger Bands. Period 20.
- Non-commercial traders are speculators such as individual traders, hedge funds, and large institutions using the futures market for speculative purposes and meeting certain requirements.
- Long non-commercial positions represent the total long open positions of non-commercial traders.
- Short non-commercial positions represent the total short open positions of non-commercial traders.
- Total non-commercial net position is the difference between short and long non-commercial trader positions.
 English
 Русский
 Bahasa Indonesia
 Bahasa Malay
 ไทย
ไทย Español
 Deutsch
 Български
 Français
 Tiếng Việt
 中文
中文 বাংলা
বাংলা हिन्दी
 Čeština
 Українська
 Română

