EUR/USD

Higher Timeframes
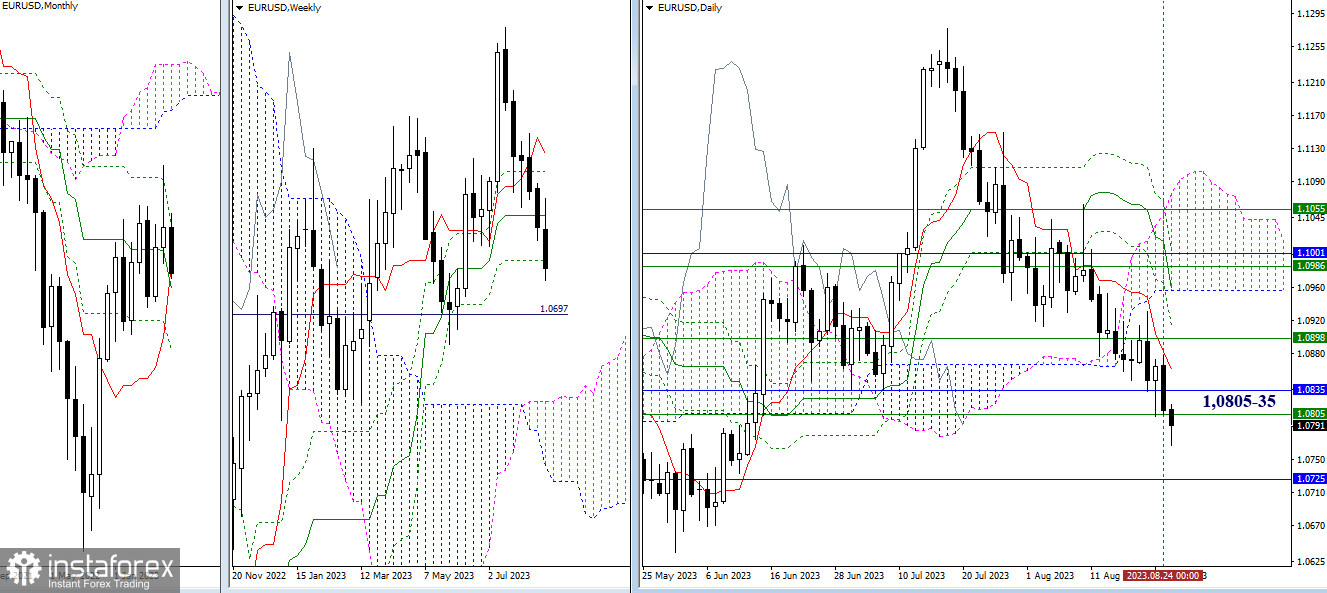
The daily rebound from the encountered supports didn't gain confirmation or further development. As a result, the pair returned to the final level of the weekly golden cross (1.0805). Today, as we close the week, the outcome is crucial. The weekly cross is currently reinforced by monthly supports at 1.0835 (Tenkan) – 1.0725 (Kijun). Therefore, the liquidation of the weekly cross would need to be bolstered by breaking important monthly support levels, which is a challenging task. The emergence of new prospects and bearish targets is only possible after breaching the specified thresholds (1.0805 – 1.0835 – 1.0725).

H4 – H1
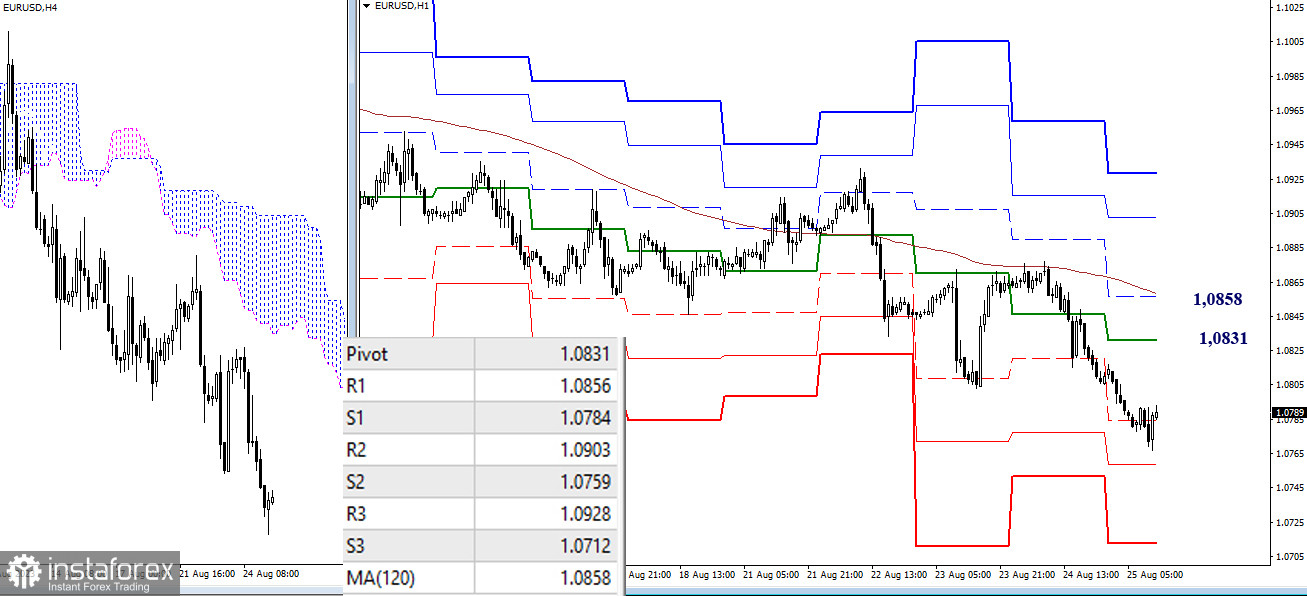
The weekly long-term trend yesterday helped the bulls defend their interests. As a result, bearish sentiments continue to strengthen in the market. The first support of the classic pivot points (1.0784) is currently being tested. Subsequently, during the day, the bears will be eyeing 1.0759 – 1.0712 (supports of the classic pivot points). Today's key levels for the lower timeframes serve as resistances and are located around 1.0831 – 1.0858 (central pivot point of the day + weekly long-term trend).
***
GBP/USD

Higher Timeframes
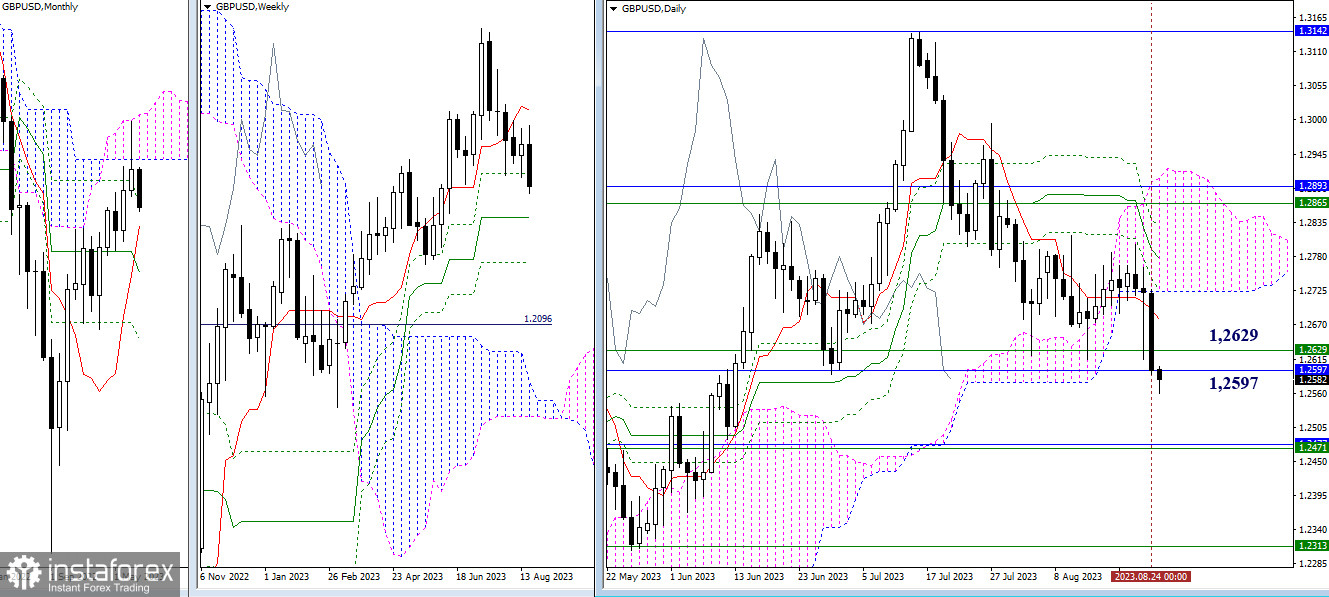
The bears weren't reconciled with the prevailing situation, so yesterday, they made a new active attempt and returned to test the support zone, which merged the weekly Fibo Kijun (1.2629) and the monthly one (1.2597). Overcoming this will shift all focus to the support thresholds at 1.2471 (weekly medium-term trend + monthly short-term trend). Resistances, from which the bears aim to break away, are today positioned at 1.2679 (daily short-term trend) and 1.2724 (lower boundary of the daily cloud).

H4 – H1
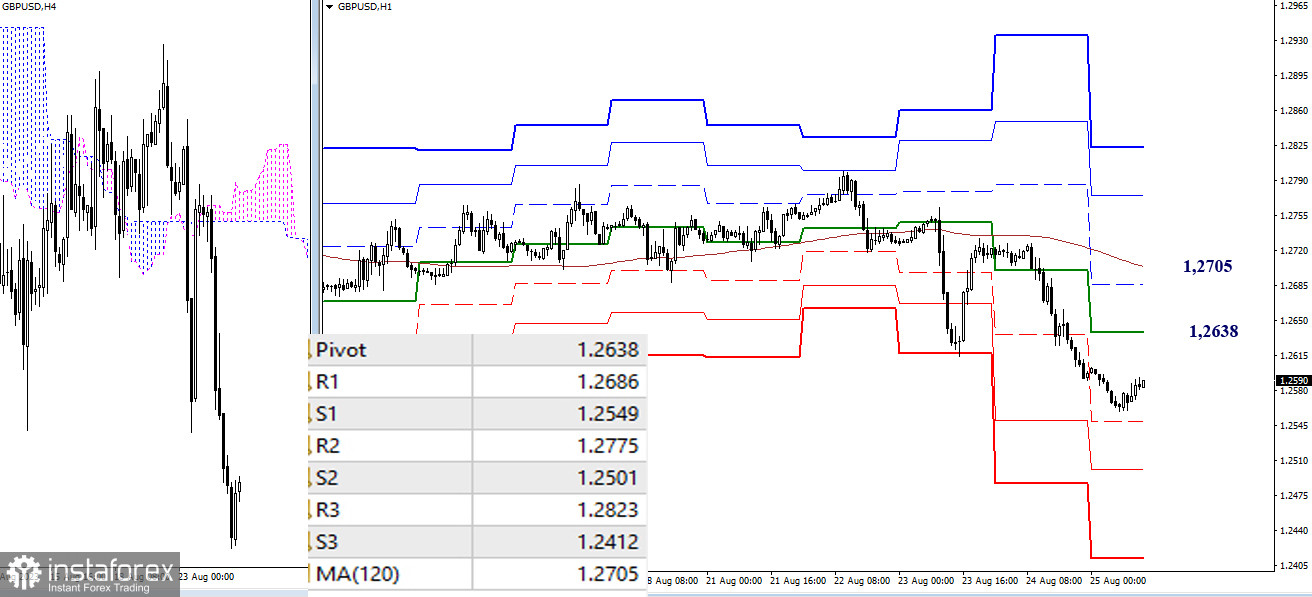
Yesterday's weekly long-term trend maintained a primary advantage on the side of the bears. As a result, the decline continued. Today's bearish targets within the day are guided by classic pivot points (1.2549 – 1.2501 – 1.2412). Today's key levels act as resistances and will confront the market in case of a correction development at thresholds of 1.2638 (central pivot point of the day) and 1.2705 (weekly long-term trend).
***
The technical analysis of the situation uses:
Higher timeframes - Ichimoku Kinko Hyo (9.26.52) + Fibo Kijun levels
Lower timeframes - H1 - Pivot Points (classic) + Moving Average 120 (weekly long-term trend)
 English
 Русский
 Bahasa Indonesia
 Bahasa Malay
 ไทย
ไทย Español
 Deutsch
 Български
 Français
 Tiếng Việt
 中文
中文 বাংলা
বাংলা हिन्दी
 Čeština
 Українська
 Română

