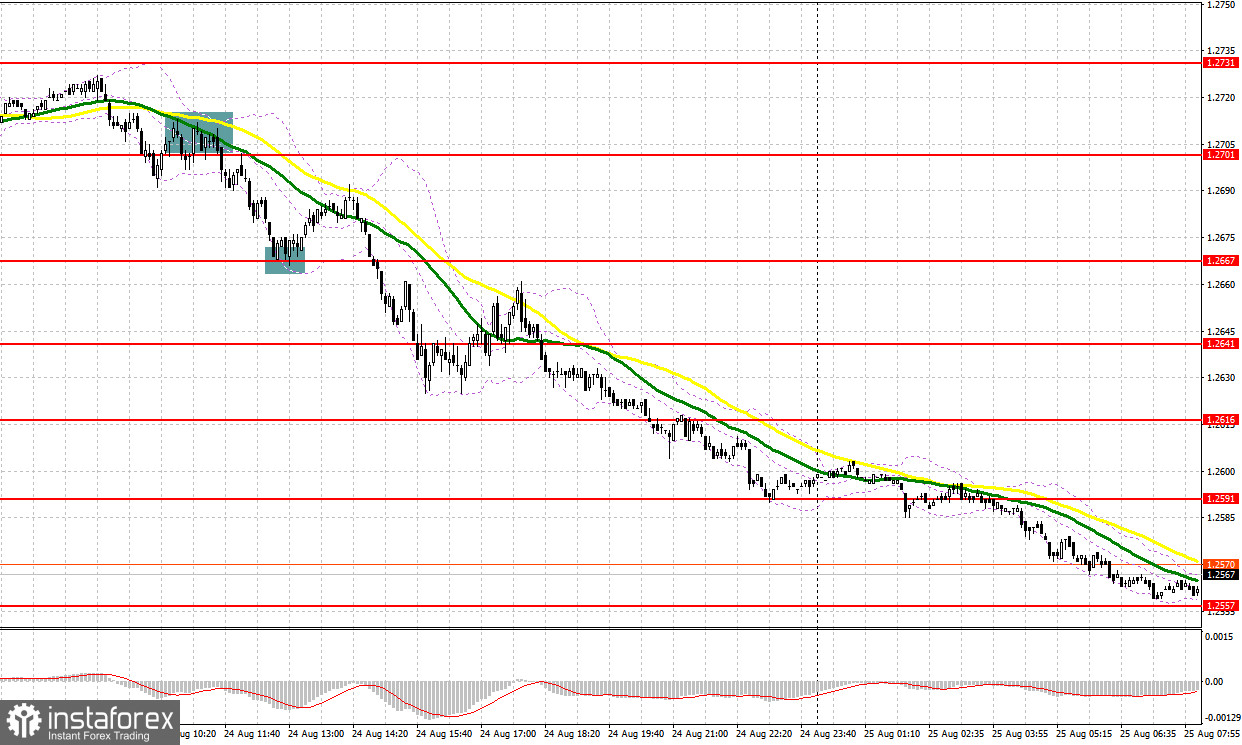
Yesterday, several market entry signals were formed. Let's examine the 5-minute chart and delve into what happened there. In the previous forecast, I drew your attention to the level of 1.2706 and recommended entering the market from it. The pair pierced and tested this level, creating a sell signal, resulting in a 30-point drop. In the second half of the day, the support of 1.2667 provided a good entry point for buying the British currency, leading to a rise of over 25 points, after which the pair continued to decline.

Long positions on GBP/USD:
The pound continues to decline, catching up with other risk assets that have already weakened against the US dollar. More market participants are counting on hawkish statements from Fed Chair Jerome Powell, who will speak at the Jackson Hole Symposium. His colleagues made it clear yesterday that while the peak of interest rates was imminent, no one is immune to future rate hikes this autumn. If Powell sticks to a hawkish policy today, the British pound may fall deeper. With no other fundamental statistics from the UK, it is better to buy the currency against the trend only after receiving clear buy signals.
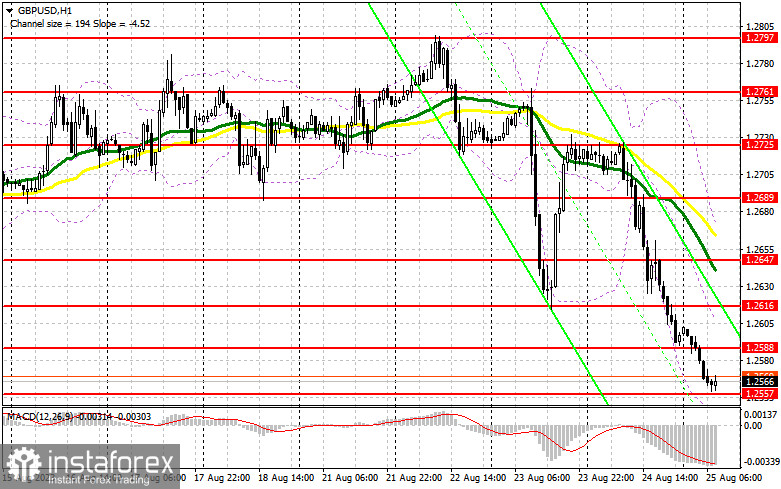
Only a false breakout near the new support level of 1.2557 may provide an entry point into long positions, anticipating a recovery and an update of the nearest resistance at 1.2588, formed based on yesterday's results. A breakthrough and a consolidation above this range may restore buyer confidence, preserving chances to reach 1.2588. The next target will be near 1.2616, where profits can be taken. If the pair declines to 1.2557 with a lack of buyers in the market, which is likely to happen in the first half of the day, pressure on the pound will increase. In that case, a false breakout at 1.2523 can give a buy signal. I plan to consider buying the British currency on a bounce only from the monthly low of 1.2488, allowing an intraday correction of 30-35 pips.
Short positions on GBP/USD:
Bears regained control of the market yesterday, aided by statements from Fed representatives. I expect the pair to continue falling, but it is best to act at lows after a correction and unsuccessful consolidation around the nearest resistance at 1.2588. This would give a sell signal with a potential decline toward 1.2557, where trading is currently taking place. A breakthrough and a retest of this level may wipe out bullish positions, enabling further development of a bearish market, possibly reaching 1.2523. The next target remains in the area near 1.2488, where one can lock in profits. Testing this level will likely occur in the second half of the day after Powell's hawkish statements. If the pair rises and we see weak trading at 1.2588, bulls will hardly see any changes. it would be better to postpone sales until the pair forms a false breakout at 1.2616. If downward movement stalls there, one can sell the British pound on a bounce from 1.2647, allowing an intraday correction of 30-35 pips.

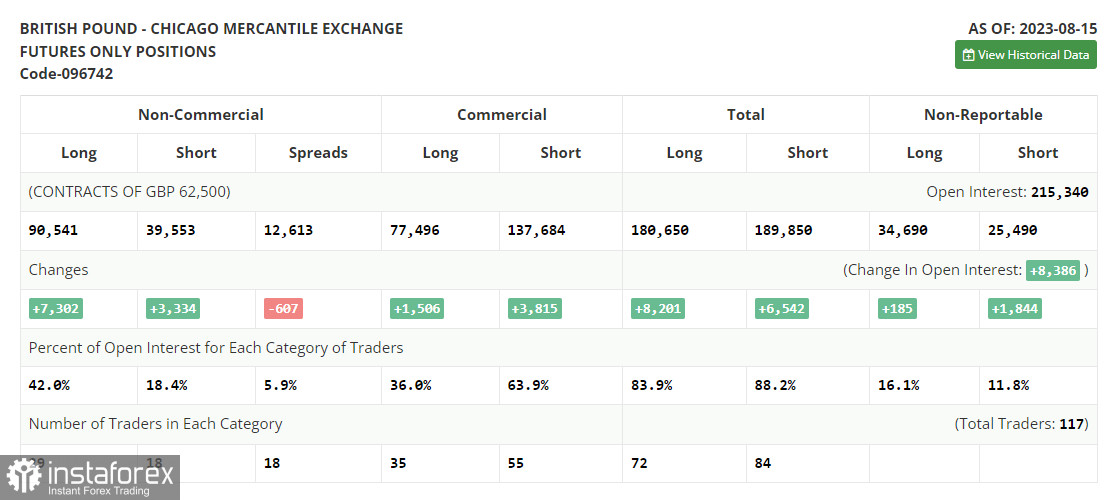
The COT report for August 15 logged that long and short positions saw an increase. Traders were building positions after the UK's GDP data, which exceeded economists' expectations. Price decreases in the US also affected the balance, supporting the pound, as did the high underlying pressure in the UK. The Jackson Hole Symposium at the end of this week could lead to further short-term strengthening of the British pound. It's crucial to hear Fed Chair Jerome Powell's views on future US monetary policy. As before, buying the pound on dips remains the optimal strategy, as the divergence in central bank policies will influence the prospects of the US dollar, exerting pressure on it. The latest COT report shows that non-commercial long positions increased by 7,302 to 90,541, while non-commercial short positions jumped by 3,334 to 39,553. The spread between long and short positions decreased by 607. The weekly price dropped to 1.2708 from 1.2749.

Indicator Signals:
Moving Averages
Trading is occurring below the 30 and 50-day moving averages, indicating further decline in the pair.
Note: The author considers the period and prices of moving averages on the H1 chart, differing from the general definition of classic daily moving averages on the D1 chart.
Bollinger Bands
In case of a decline, the lower boundary of the indicator around 1.2557 will provide support.
Indicator Descriptions:
- Moving Average determines the current trend by smoothing volatility and noise. Period 50. Marked in yellow on the chart;
- Moving Average determines the current trend by smoothing volatility and noise. Period 30. Marked in green on the chart;
- MACD Indicator (Moving Average Convergence/Divergence). Fast EMA 12. Slow EMA 26. SMA 9;
- Bollinger Bands. Period 20;
- Non-commercial traders are speculators, such as individual traders, hedge funds, and large institutions, using the futures market for speculative purposes and subject to specific requirements;
- Non-commercial long positions represent the total open long position of non-commercial traders;
- Non-commercial short positions represent the total open short position of non-commercial traders;
- The non-commercial net position is the difference between non-commercial traders' short and long positions.
 English
 Русский
 Bahasa Indonesia
 Bahasa Malay
 ไทย
ไทย Español
 Deutsch
 Български
 Français
 Tiếng Việt
 中文
中文 বাংলা
বাংলা हिन्दी
 Čeština
 Українська
 Română

