Analyzing Thursday's trades:
GBP/USD on 30M chart

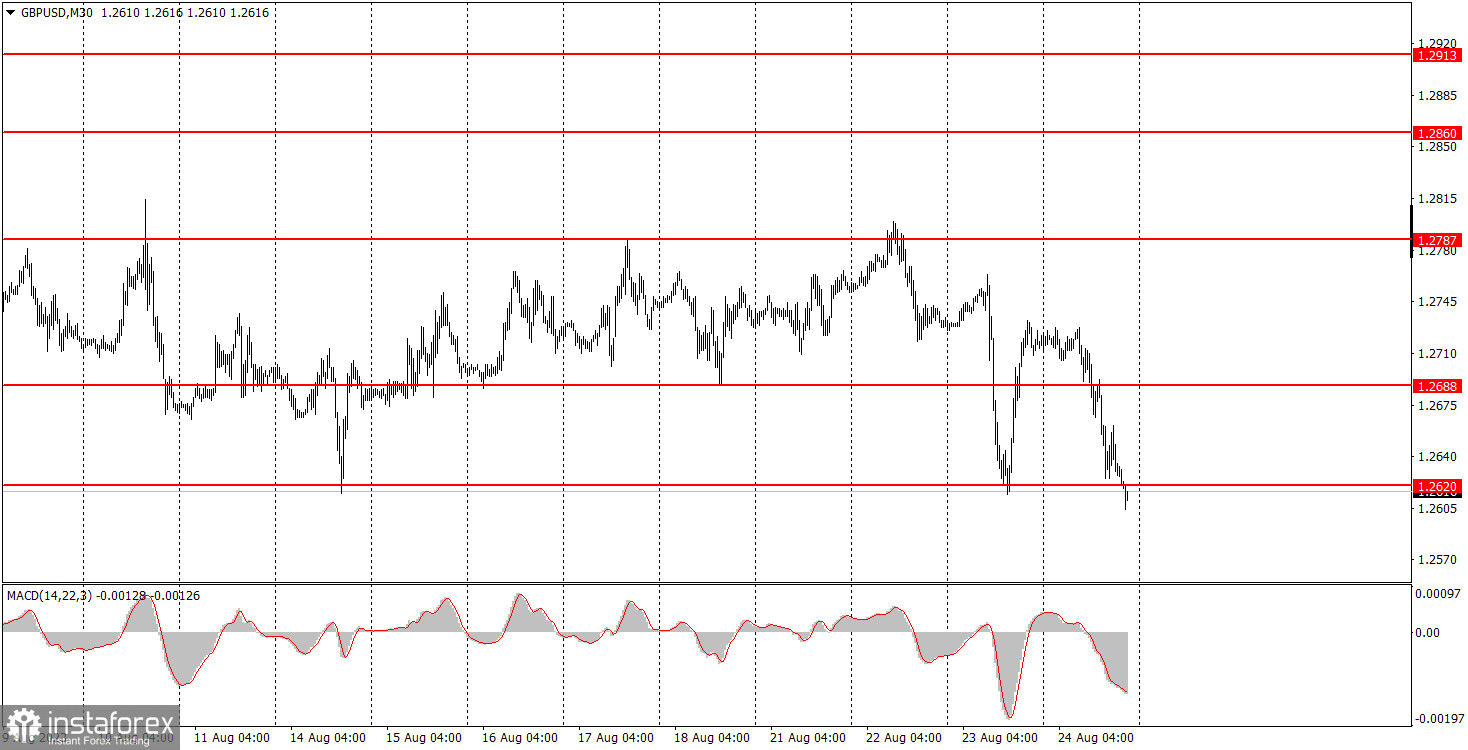
On Thursday, the GBP/USD pair fell to the lower band of the sideways channel, and this time the pair seems set to break through it. The pound sterling has already consolidated below the 1.2620 level, but it is still relatively weak. Nevertheless, the fact that even after the pair rebounded from this level on Wednesday, it did not aim for the upper band of the channel but returned to the lower one, indicates a possibility of traders bringing back the downtrend and an exit from the consolidation phase.
There were two reports that could influence the pair's movement. Neither was good enough to push the dollar by 100 pips. This is another factor that suggests a potential revival of the downward movement. This is what we're counting on. We certainly don't expect the pound sterling to surge anytime soon. But who knows what Federal Reserve Chair Jerome Powell will reveal to the market on Friday...
GBP/USD on 5M chart

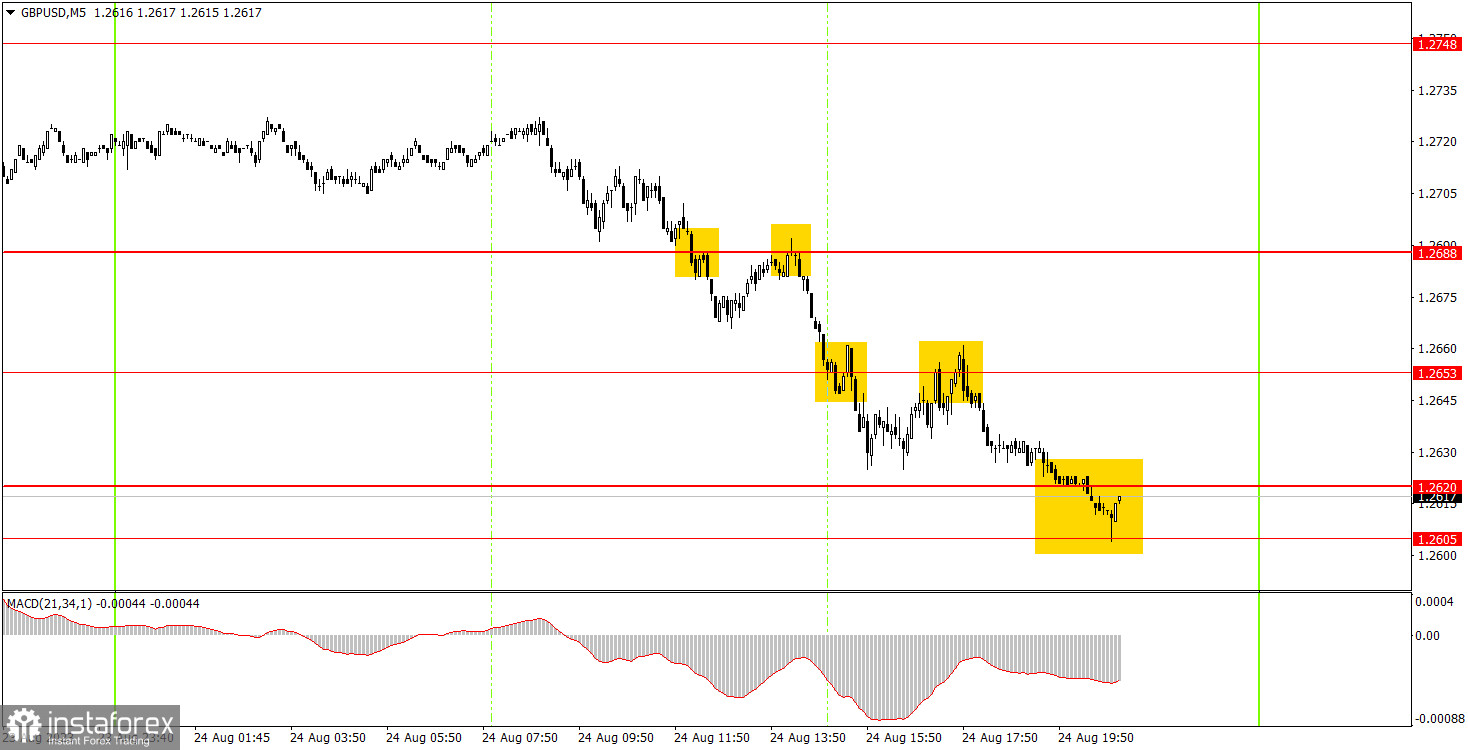
Several trading signals were formed on the 5-minute chart. Midway through the European trading session, the pair settled below the 1.2688 level, which should have been taken as a sell signal. Subsequently, the price rebounded from this level, surpassed the 1.2653 mark, bounced off it from the bottom, and descended to the 1.2605-1.2620 area. The price did not form a buy signal at midnight, the short positions should have been closed manually. The profit stood at about 60 pips, which is an excellent result. Therefore, Thursday's movement was quite commendable.
Trading tips on Friday:
On the 30-minute chart, the GBP/USD pair continues to tread within a sideways channel. We're still leaning towards a further decline in the British pound, believing it's currently overbought and unjustifiably pricey. However, the price hasn't left the consolidation phase yet, so there might be a new rebound from the 1.2620 level, which can push the pair's growth. The key levels on the 5M chart are 1.2457, 1.2499, 1.2538, 1.2605-1.2620, 1.2653, 1.2688, 1.2748, 1.2787-1.2791, 1.2848-1.2860. Once the price moves 20 pips in the right direction after opening a trade, you can set the stop-loss at breakeven. On Friday, there's nothing particularly noteworthy slated in the UK. Investors will be expecting to listen to Powell's remarks in the Jackson Hole symposium.
Basic trading rules:
1) The strength of the signal depends on the time period during which the signal was formed (a rebound or a break). The shorter this period, the stronger the signal.
2) If two or more trades were opened at some level following false signals, i.e. those signals that did not lead the price to Take Profit level or the nearest target levels, then any consequent signals near this level should be ignored.
3) During the flat trend, any currency pair may form a lot of false signals or do not produce any signals at all. In any case, the flat trend is not the best condition for trading.
4) Trades are opened in the time period between the beginning of the European session and until the middle of the American one when all deals should be closed manually.
5) We can pay attention to the MACD signals in the 30M time frame only if there is good volatility and a definite trend confirmed by a trend line or a trend channel.
6) If two key levels are too close to each other (about 5-15 pips), then this is a support or resistance area.
How to read charts:
Support and Resistance price levels can serve as targets when buying or selling. You can place Take Profit levels near them.
Red lines are channels or trend lines that display the current trend and show which direction is better to trade.
MACD indicator (14,22,3) is a histogram and a signal line showing when it is better to enter the market when they cross. This indicator is better to be used in combination with trend channels or trend lines.
Important speeches and reports that are always reflected in the economic calendars can greatly influence the movement of a currency pair. Therefore, during such events, it is recommended to trade as carefully as possible or exit the market in order to avoid a sharp price reversal against the previous movement.
Beginners should remember that every trade cannot be profitable. The development of a reliable strategy and money management are the key to success in trading over a long period of time.
 English
 Русский
 Bahasa Indonesia
 Bahasa Malay
 ไทย
ไทย Español
 Deutsch
 Български
 Français
 Tiếng Việt
 中文
中文 বাংলা
বাংলা हिन्दी
 Čeština
 Українська
 Română

