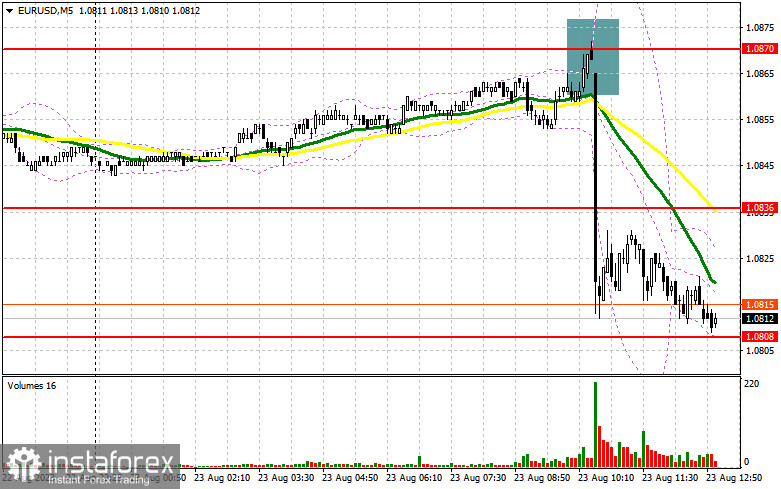
In my morning forecast, I highlighted the level of 1.0870 and recommended making decisions on entering the market from it. Let's look at the 5-minute chart and ty to figure out what happened there. Growth and a false breakdown at this level produced a sell signal. As a result, the instrument fell by more than 60 pips. In the second half of the day, the technical picture was revised.

What is needed to open long positions on EUR/USD
Terrible PMI indices, ranging from the manufacturing sector to the service sector in the eurozone countries, set the stage for a major collapse of the euro in the first half of the day. During the US session, similar reports are expected for the US. If the indices there demonstrate more or less stable conditions, then we can expect another wave of the fall in EUR/USD. If business activity also declines sharply or even enters negative territory, the euro may partially make up for the losses, but I would not count on strong growth amid such fundamentals.
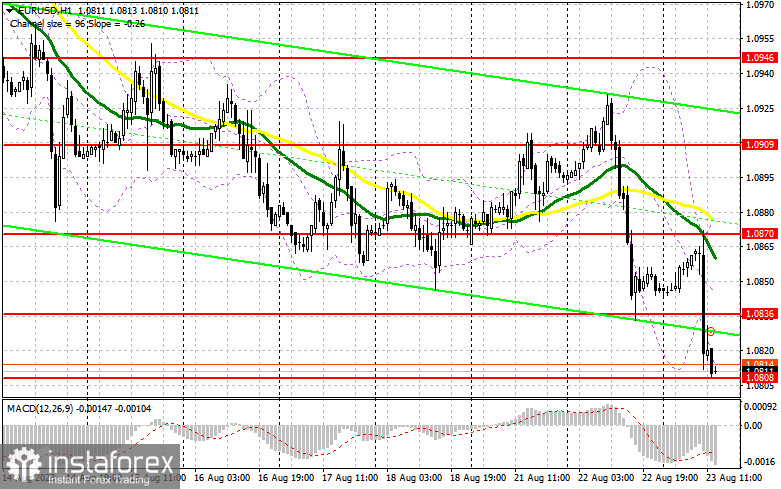
To go long, it's best to wait for the decline and a false breakout in the support area of 1.0808. The test of this level is about to take place in the near future. To be honest, I don't count on a notable rebound, perhaps only in the case of weak statistics for the United States. The instrument could climb to the nearest resistance 1.0836, where the sellers will assert themselves again. A break and test from top to bottom at 1.0836 will bring back demand for the euro, giving a chance for a surge up and an update at 1.0870, where the moving averages play on the side of the bears. The area of 1.0870 remains the highest target, where I will take profits.
With the option of EUR/USD trading lower and no activity at 1.0808 in the afternoon, which is quite possible, given the data on the eurozone, the pressure on the pair will only increase. In this case, only a false breakout in the area of the next support at 1.0777, a new monthly low, will give a signal to buy the euro. I will open long positions immediately on a dip from 1.0734 with the aim of an intraday upward correction of 30-35 pips.
What is needed to open short position on EUR/USD
The sellers are setting the tone for the market. In light of the morning PMIs, you can safely bet on EUR/USD's decline. Of course, it would be nice to see an upward correction and the intrusion of major players in the nearest resistance area of 1.0836. A false breakout at this level will generate a new sell signal on the grounds of the bear market, which will open a direct path to new support at 1.0808. Only after a breakout and consolidation below this range, as well as a reverse test from the bottom up, a sell signal be produced, allowing EUR/USD to update monthly lows to the 1.0777 area.
The lowest target will be the area of 1.0734, which will indicate that the bearish trend is over. I will take profit there. If EUR/USD moves higher during the US session and the bears are absent at 1.0836 with very weak US PMIs, the situation will return to the buyers' hands. With this development of events, I will postpone short positions until the next resistance at 1.0870. You can also sell there, but only after an unsuccessful consolidation. I will open short positions immediately on a rebound from the high of 1.0909 with the aim of a downward correction of 30-35 pips.

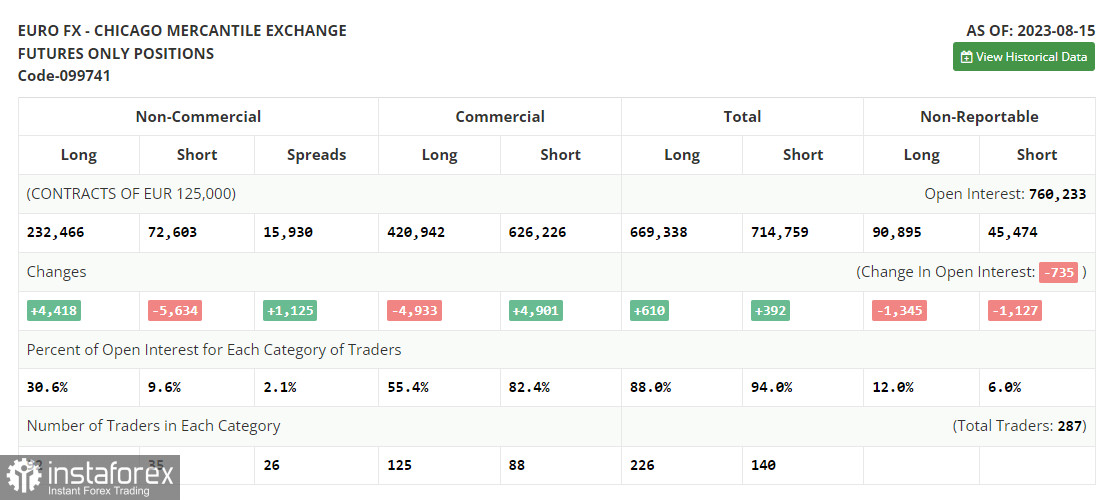
In the COT report (Commitment of Traders) for August 15, there was an increase in long positions and a decrease in short ones. These figures already allow for important data on inflation in the US. As we can see, some buyers returned to the market. The minutes of the Federal Reserve published last week also showed that not all members of the committee were ready to raise interest rates to fight inflation. This keeps the chances of a recovery for the euro, especially after the Jackson Hole symposium later this week, at which Fed Chairman Jerome Powell will speak.
Perhaps his speech will shed light on further policy moves of the central bank. It is important to note that the recent fall of the euro is quite an attractive moment because despite this, the optimal medium-term strategy in the current conditions remains buying risky assets on the decline. The COT report indicated that long non-commercial positions rose by 4,418 to 232,466, while short non-commercial positions decreased by 5,634 to 72,603. As a result, the spread between long and short positions jumped by 1,125. The currency pair closed lower at 1.0922 against 1.0981 a week earlier.

Indicators' signals
Moving Averages
The instrument is trading below the 30 and 50-day moving averages. It indicates that the bear market is still going on.
Note: The period and prices of the moving averages are considered by the analyst on the 1-hour chart and differ from the general definition of classic daily moving averages on the daily chart.
Bollinger Bands
In case EUR/USD extends its growth, the indicator's upper border around 1.0870 will act as resistance.
Description of indicators
- Moving average (moving average, determines the current trend by smoothing out volatility and noise). Period 50. It is marked yellow on the chart.
- Moving average (moving average, determines the current trend by smoothing out volatility and noise). Period 30. It is marked green on the chart.
- MACD indicator (Moving Average Convergence/Divergence — convergence/divergence of moving averages) Quick EMA period 12. Slow EMA period to 26. SMA period 9
- Bollinger Bands (Bollinger Bands). Period 20
- Non-commercial speculative traders, such as individual traders, hedge funds, and large institutions that use the futures market for speculative purposes and meet certain requirements.
- Long non-commercial positions represent the total long open position of non-commercial traders.
- Short non-commercial positions represent the total short open position of non-commercial traders.
- Total non-commercial net position is the difference between short and long positions of non-commercial traders.
 English
 Русский
 Bahasa Indonesia
 Bahasa Malay
 ไทย
ไทย Español
 Deutsch
 Български
 Français
 Tiếng Việt
 中文
中文 বাংলা
বাংলা हिन्दी
 Čeština
 Українська
 Română

