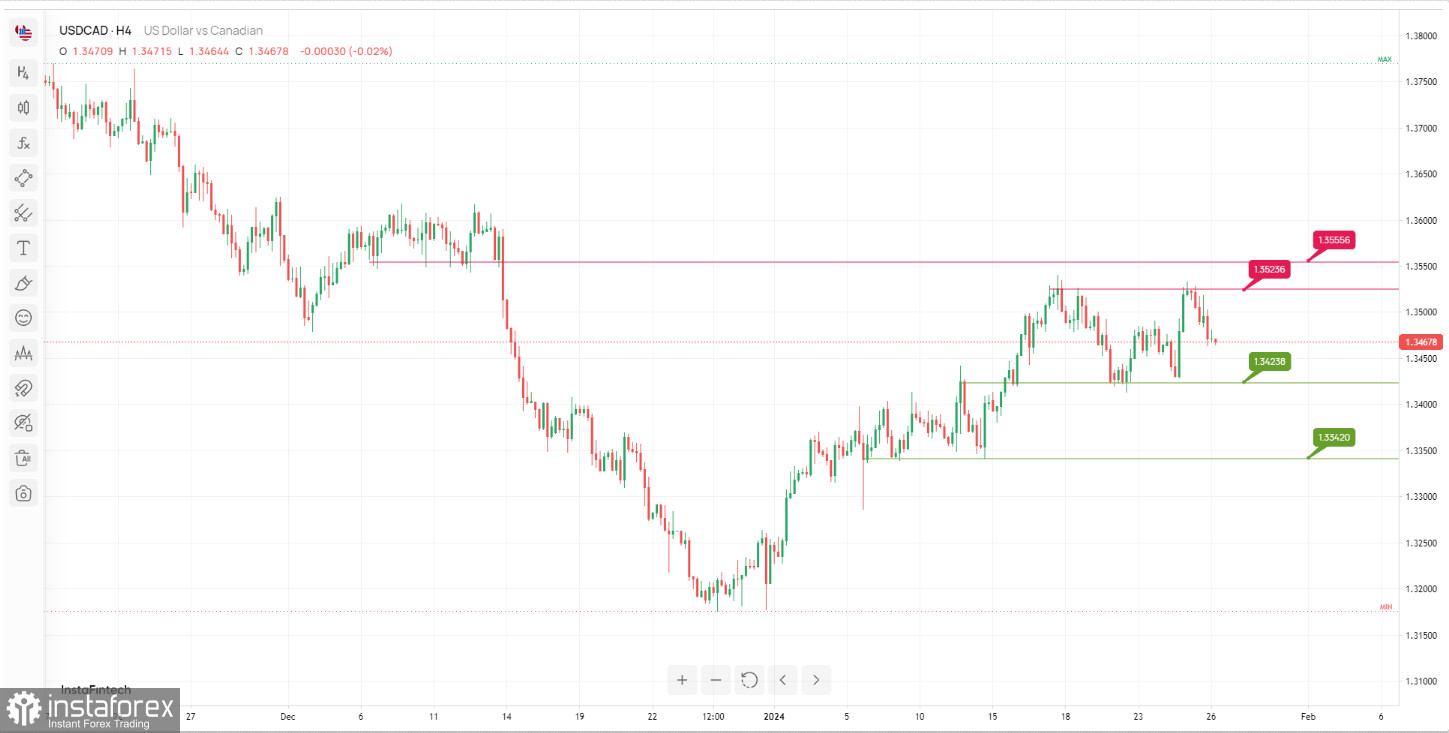
The USD/CAD chart analysis suggests a potential bearish continuation for price with the following key resistance and support levels:
Resistance Levels:
The 1st resistance level at 1.3523 is identified as a "Pullback resistance". This level represents a significant barrier for upward price movement.
The 2nd resistance level at 1.3555 is also described as a "Pullback resistance", indicating another critical resistance zone.
Support Levels:
The 1st support level at 1.3423 is noted as an "Overlap support". It represents a key support level where buyers may provide some stabilization.
The 2nd support level at 1.3342 is described as a "Pullback support". This level can serve as additional support below the first level.
 English
 Русский
 Bahasa Indonesia
 Bahasa Malay
 ไทย
ไทย Español
 Deutsch
 Български
 Français
 Tiếng Việt
 中文
中文 বাংলা
বাংলা हिन्दी
 Čeština
 Українська
 Română

