GBP/USD
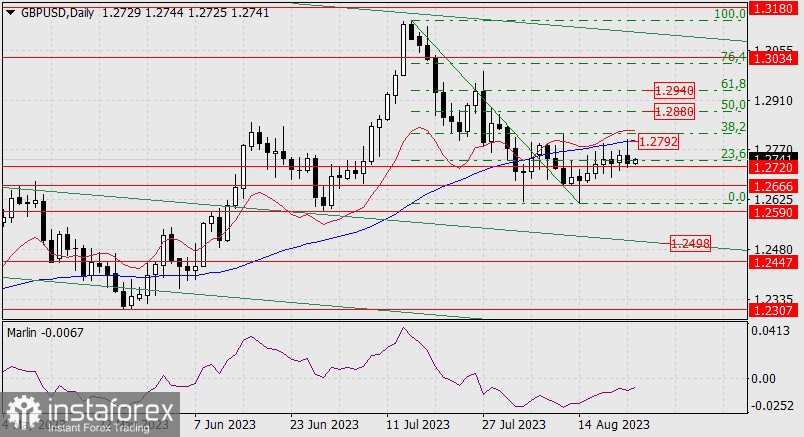
On Tuesday afternoon, the GBP/USD pair reached the MACD indicator line – the 1.2792 target, afterwards it returned to the 1.2720 support. The price has been moving in a sideways trend on this support for five days now. The Marlin oscillator is still strong, and there could be another attempt to overcome the MACD line.

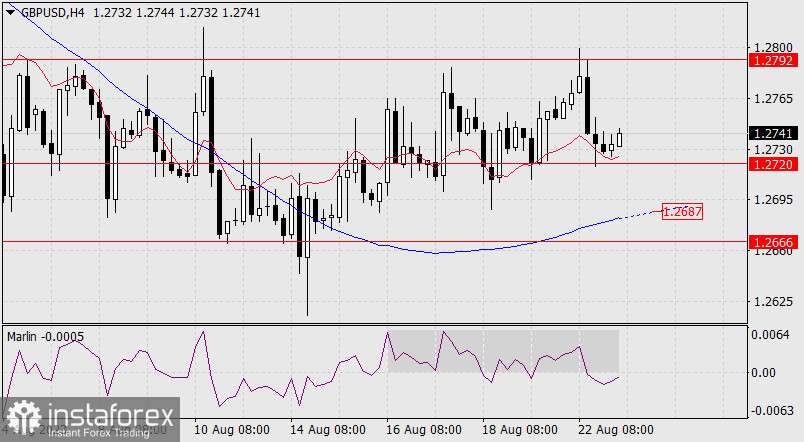
If the price consolidates below 1.2720, the five-day sideways movement will end, revealing the target at 1.2666, followed by 1.2590 (June 29 low). On the four-hour chart, the oscillator's signal line has moved out of its consolidation by moving downwards, establishing itself in the downtrend territory.

The price consolidating below 1.2720 will confirm its intention to fall, with the 1.2666 level as the target. The MACD line acts as an intermediate support around the 1.2687 mark. It coincides with a series of local extremes from early August, so if the pound plans to show a false downward movement, it might stop at the MACD line.
 English
 Русский
 Bahasa Indonesia
 Bahasa Malay
 ไทย
ไทย Español
 Deutsch
 Български
 Français
 Tiếng Việt
 中文
中文 বাংলা
বাংলা हिन्दी
 Čeština
 Українська
 Română

