BTC/USD Find Support Below $40k, Correction Terminated?
Key Takeaways:
- Market Sensitivity to External Events: Bitcoin's recent price movements, particularly around the approval of BTC-based spot ETFs, highlight its sensitivity to external market events. This underscores the importance of staying informed about industry developments when analyzing BTC/USD trends.
- Current Bearish Trend and Potential Reversal Indicators: Bitcoin is currently in a bearish phase, trading below key moving averages. However, the presence of a Pin Bar Reversal Candle at a significant support level and an oversold RSI suggest potential for a reversal or pullback, which traders and investors should monitor closely.
- Importance of Comprehensive Analysis: While technical indicators show a bearish sentiment, the sentiment scoreboard reflects a bullish outlook. This divergence emphasizes the need for a comprehensive analysis that includes both technical indicators and market sentiment when considering trading or investment decisions in the volatile cryptocurrency market.

Crypto Industry News: The third week of January begins with significant declines in the cryptocurrency market. The BTC price is rising to USD 39,000. The largest cryptocurrency also dragged the entire market with it, as the price of ETH fell by 6.6% in just 24 hours.
The BTC price drops - the bear enters the digital assets market
The approval of BTC-based spot ETFs has resulted in a sharp change in the BTC price over the last two weeks. Waiting for the SEC's decision caused the price of the first cryptocurrency on the market to jump to over USD 48,000 on January 11, only to fall below the psychological barrier of USD 40,000 during the next 14 days.
The main reason for this state of affairs are exchange-traded funds. Although in the first week spot BTC ETFs from BlackRock and Fidelity recorded as much as USD 4.13 billion inflows, there were also significant outflows. Grayscale's spot fund recorded as much as USD 2.8 billion of capital outflow. Why is this happening?
Well, some investors have already realized their profits or this is transferred to cheaper competition, because Grayscale's ETF has a high commission (compared to the offers of other entities). Nevertheless, many investors consider it an excellent opportunity to buy bitcoin at a "promotional price" before the upcoming BTC halving in April.
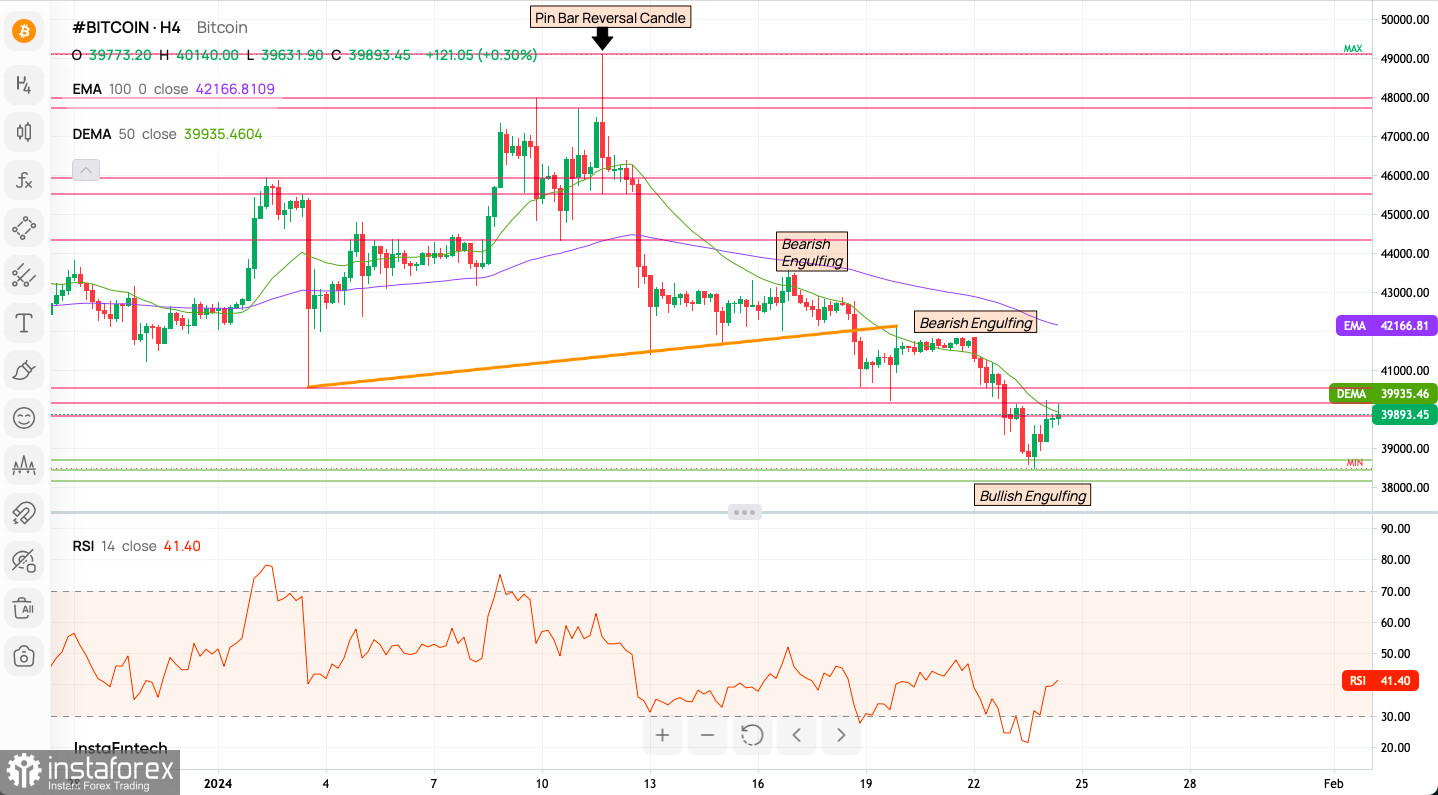
Technical Market Outlook: Bitcoin made a new yearly high at $49,126 before a sharp reversal, marked by a Pin Bar reversal candle. The last low was $38,601, indicating a -20% correction from the peak. Bitcoin has since rebounded from the $38,198 - $38,700 demand zone and is testing $40,000. Momentum remains weak and negative on the H4 chart, but the market, previously oversold, is showing signs of increased momentum. The immediate upside is capped at $39,822 - $40,568.

Trend Analysis: The bearish trend is evident with Bitcoin trading below both the 100-period EMA and the 50-period DEMA.
Support and Resistance Levels:
- Strong support: Approximately $39,090.62.
- Resistance: Likely near EMA ($42,430.63) and DEMA ($40,421.34).
Candlestick Patterns:
- Bearish Engulfing patterns suggest a bearish sentiment.
- A Pin Bar Reversal Candle at a significant support level may indicate a potential bullish reversal.
Indicators:
- The RSI, at 25.20, signals an oversold market, hinting at a possible reversal or pullback.
Intraday 1H Indicator Signals:
- Sell signals: 21 out of 21 technical indicators.
- Moving Averages: 18 out of 18 indicate Sell.
Sentiment Scoreboard:
- Current sentiment: Bullish (69% bulls vs. 31% bears).
- Last week: Bullish (55% bulls vs. 45% bears).
- Past three days: Slight decrease in bullish sentiment (55% bulls vs. 45% bears).
Weekly Pivot Points:
- WR3 - $42,940
- WR2 - $41,993
- WR1 - $41,450
- Weekly Pivot - $41,046
- WS1 - $40,503
- WS2 - $40,100
- WS3 - $39,153
Technical Insights:
- Bearish Phase: Short opportunities may arise on pullbacks to resistance levels.
- Long Position Consideration: Look for significant reversal signs.
- Contextual Analysis: Stay informed with news and fundamental factors.
- Risk Management: Essential to complement technical analysis.
Useful Links
Important Notice
The begginers in forex trading need to be very careful when making decisions about entering the market. Before the release of important reports, it is best to stay out of the market to avoid being caught in sharp market fluctuations due to increased volatility. If you decide to trade during the news release, then always place stop orders to minimize losses.
Without placing stop orders, you can very quickly lose your entire deposit, especially if you do not use money management and trade large volumes. For successful trading, you need to have a clear trading plan and stay focues and disciplined. Spontaneous trading decision based on the current market situation is an inherently losing strategy for a scalper or daytrader.
 English
 Русский
 Bahasa Indonesia
 Bahasa Malay
 ไทย
ไทย Español
 Deutsch
 Български
 Français
 Tiếng Việt
 中文
中文 বাংলা
বাংলা हिन्दी
 Čeština
 Українська
 Română

