 English
  Русский
 Bahasa Indonesia
 Bahasa Malay
 ไทย
ไทย Español
 Deutsch
 Български
 Français
 Tiếng Việt
 中文
中文 বাংলা
বাংলা हिन्दी
 Čeština
 Українська
 Română

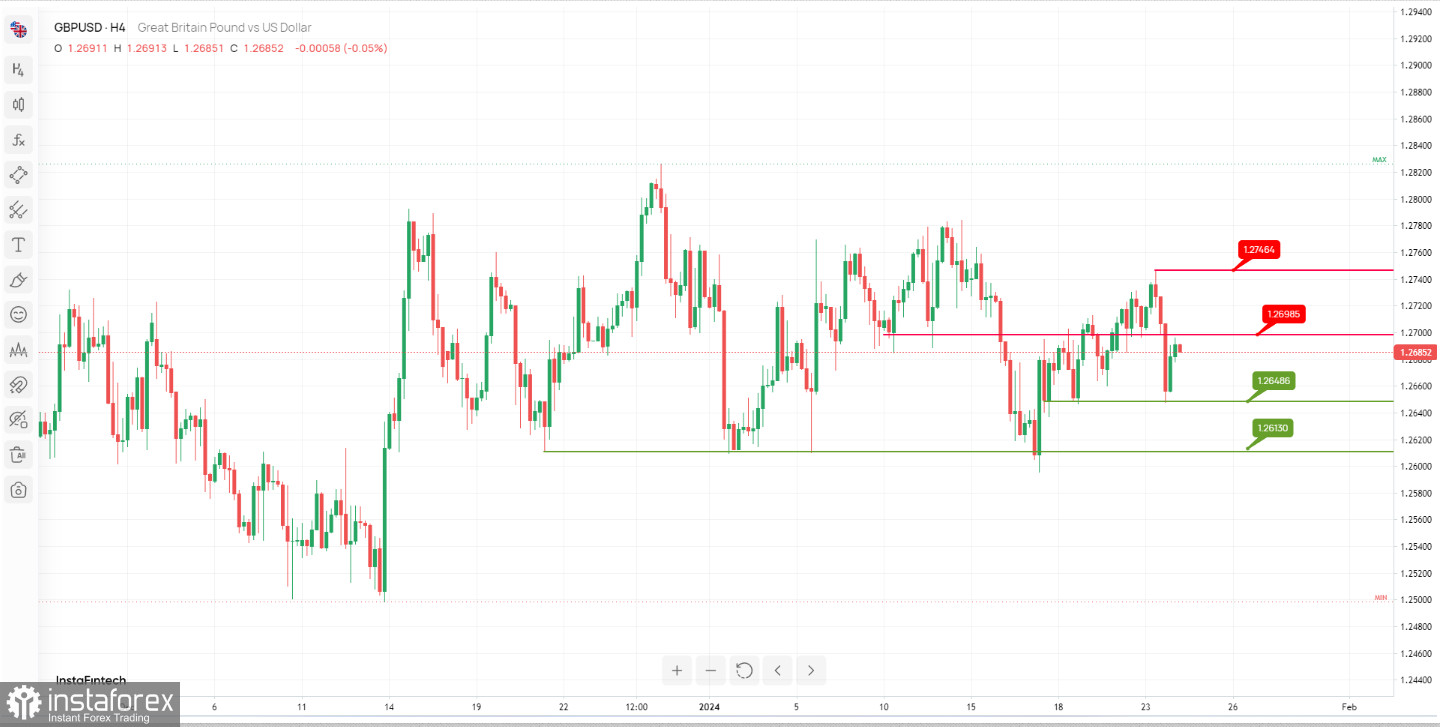
The GBP/USD (British Pound/US Dollar) chart analysis suggests a potential bearish scenario with a continuation toward the support levels:
Resistance Levels:
The 1st resistance level at 1.2699 is labeled as "An Overlap resistance." This level represents a significant resistance zone where sellers may dominate.
The 2nd resistance level at 1.2746 is identified as "Swing high resistance." It signifies another resistance level that traders should consider.
Support Levels:
The 1st support level at 1.2649 is described as "Multi-swing low support." This level could act as a key support zone where buyers might enter the market.
The 2nd support level at 1.2613 is also labeled as "Multi-swing low support." It represents an additional support zone below the first level.