GBP/USD In A Steady Ascent Amid Market Fluctuations
Key Takeaways:
- GBP/USD shows a moderate uptrend, supported by moving averages and bullish candlestick patterns.
- Indicators like the RSI suggest a balanced momentum, not yet overextended.
- Market watch points include reaction to key support levels and moving averages for potential trend shifts.
Technical Market Outlook:
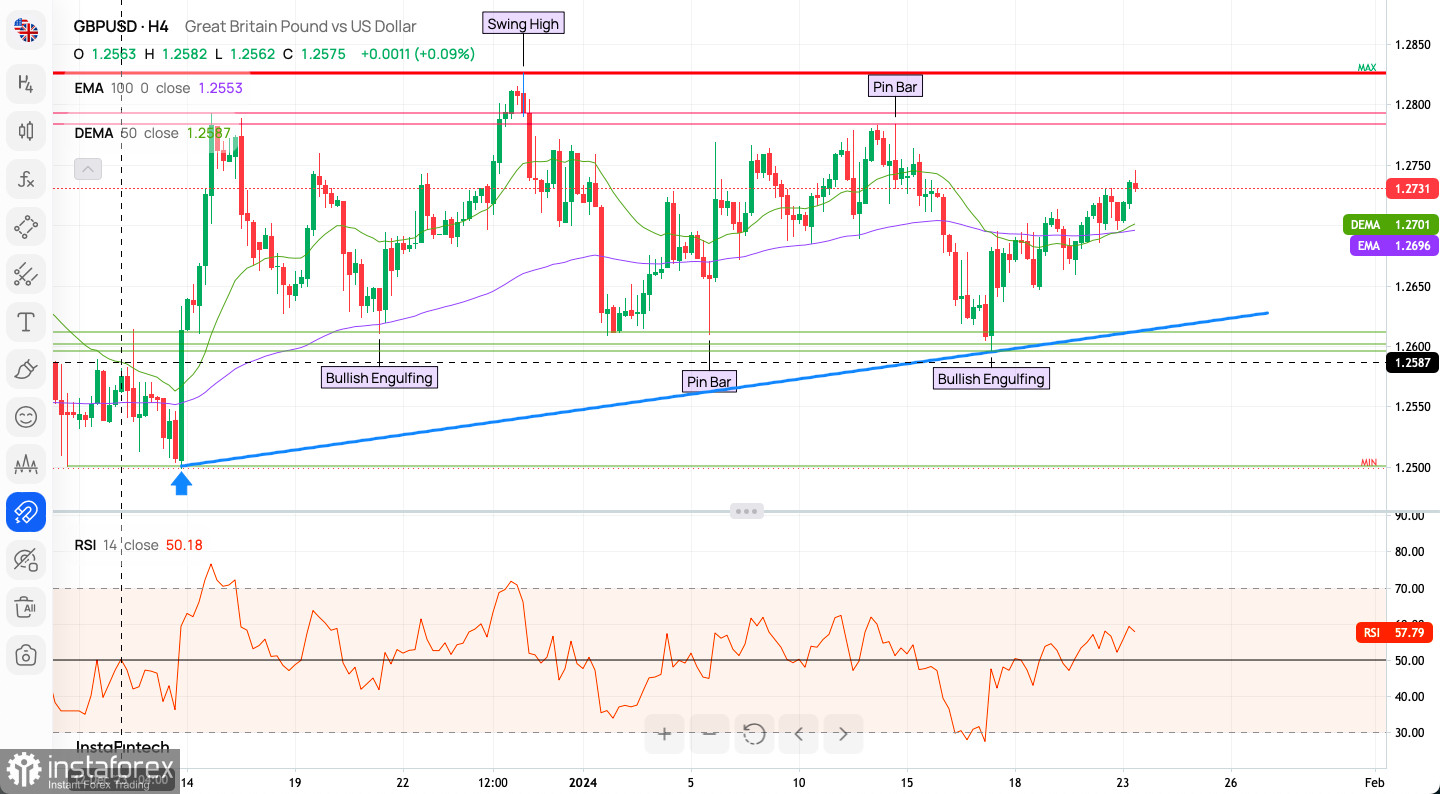
The GBP/USD pair has recently exhibited an upward trajectory, surpassing the 50 MA on the H4 chart and reaching a local high at 1.2723. This uptrend, however, faced a reversal, bringing into focus the next bear targets at 1.2675 and 1.2645, which are key intraday support levels. Resistance is currently pegged at 1.2723. Notably, the momentum is shifting from positive to a more neutral or negative outlook.
Crucial support lies between 1.2615 and 1.2595. A decisive break below this zone could signify a shift to a more bearish market sentiment.
Trends and Candlestick Patterns:
The GBP/USD price movement is supported by an ascending trendline, indicating a general uptrend. This bullish sentiment is further reinforced by the price position above both the 100-period EMA (1.2696) and the 60-period DEMA (1.2701), which act as dynamic support levels.
Candlestick analysis reveals 'Bullish Engulfing' patterns, signaling strong buying interest and potential bullish reversals. Additionally, 'Pin Bar' formations suggest price rejection and possible reversal points.
RSI Indicator Insights:
The Relative Strength Index (RSI) stands near 57.79, slightly above the midpoint but below the overbought threshold, indicating a moderate bullish momentum.
A recent 'Swing High' point on the chart suggests a local price peak before a retracement, aligning with the overall moderate uptrend.

Intraday H1 Indicator Insights and Market Sentiment:
On the H1 timeframe:
- Buy signals are dominant, with 17 out of 21 technical indicators and all 18 moving averages favoring a bullish stance.
- The sentiment scoreboard mirrors this bullish trend (58% bulls vs. 42% bears), consistent with last week's sentiment.
Weekly Pivot Points:
Key pivot points for the week:
- WR3: 1.27727
- WR2: 1.27416
- WR1: 1.27282
- Weekly Pivot: 1.27105
- WS1: 1.26971
- WS2: 1.26794
- WS3: 1.26483
Trading Insights:
A downward breach of the trendline could hint at a bearish turn. However, the bullish engulfing patterns and support rebound suggest potential for a rally. The RSI indicates a waning bearish momentum, though not strongly signaling an imminent reversal.
Key to watch is the price action around the moving averages. A sustained move above the EMA and DEMA may indicate a return to bullish momentum. Conversely, failing to hold above key short-term support might lead to further decline.
The GBP/USD pair presents a nuanced trading landscape. Current indicators and trends point towards a cautiously bullish outlook, with key levels and patterns providing essential insights. Traders should remain vigilant, observing how the pair interacts with pivotal support and resistance zones, to inform their market strategies. As always, understanding the balance of potential rewards and associated risks is crucial in forex trading.
Useful Links
Important Notice
The begginers in forex trading need to be very careful when making decisions about entering the market. Before the release of important reports, it is best to stay out of the market to avoid being caught in sharp market fluctuations due to increased volatility. If you decide to trade during the news release, then always place stop orders to minimize losses.
Without placing stop orders, you can very quickly lose your entire deposit, especially if you do not use money management and trade large volumes. For successful trading, you need to have a clear trading plan and stay focues and disciplined. Spontaneous trading decision based on the current market situation is an inherently losing strategy for a scalper or daytrader.
 English
 Русский
 Bahasa Indonesia
 Bahasa Malay
 ไทย
ไทย Español
 Deutsch
 Български
 Français
 Tiếng Việt
 中文
中文 বাংলা
বাংলা हिन्दी
 Čeština
 Українська
 Română


