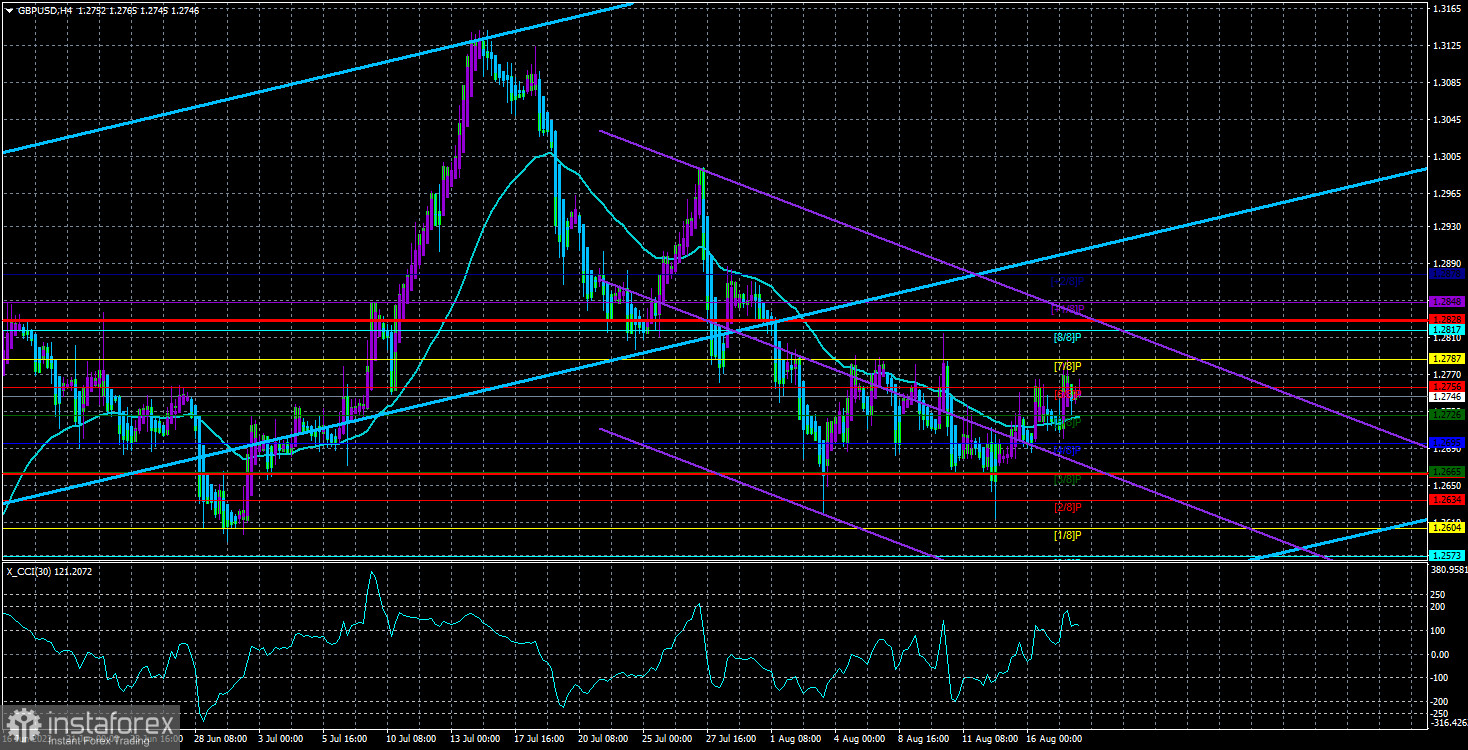
On Thursday, the GBP/USD currency pair attempted to continue its upward movement, but it still occurs within a sideways channel. The upper boundary of this channel is clear - it is at the 1.2787 level. Thus, a rebound can be expected from this level, or the pair may turn down below it. Within the sideways channel, the movements can be entirely random and not necessarily a rebound from its boundaries. As there won't be any strong fundamental and macroeconomic news on Friday, we do not expect the price to consolidate above this channel. Therefore, a decline back to the 1.2634 level is likely in the short term.
In the medium term, the downward trend remains, and the fundamental and macroeconomic backgrounds do not support the pound now. We have not seen a strong upward correction, but considering the overall overbought state of the pound and its growth over the last 11 months, the pair may continue to fall even without strong upward corrections. Therefore, the direction now depends largely on technical analysis and market sentiment, which has already shifted to a downward trend. If this is the case, the decline will resume next week or the week after.
On the 24-hour timeframe, the pair has not yet consolidated below the Ichimoku cloud, so the global upward trend is still in place. Furthermore, the current technical picture with high probability allows us to expect its continuation and resumption. The price has corrected by 500 points again, which is not enough to consider the correction "strong" and expect the end of the upward trend. The pound has no reason to continue growing, but the market may think otherwise. Therefore, we closely monitor the Senkou Span B line.
The market awaits new statements from the Bank of England.
Perhaps the most interesting question now, and almost the only hope for the pound, is the rhetoric of the Bank of England regarding the remaining meetings in 2023. So far, the market is confident that the key rate will rise twice more, and these two increases (no doubt) have already been priced in. However, if the rhetoric of the Monetary Committee representatives tightens (which is entirely possible given the current inflation in the UK), the market may find new reasons for new purchases. The current value of the pound in dollars suggests that all possible rate hikes by the Bank of England have been priced in, but this does not mean that the market has priced them in with 100% certainty.
As for the macroeconomic component, statistics from the UK have not been pleasing traders for a long time, which has yet to prevent them from actively buying the pound over the past 11 months. Therefore, macroeconomics is now receding not to the background but to the tertiary level. We, as before, expect a strong and prolonged fall in the British currency.
Today in the UK, the only report of the day on retail sales was released. As one might guess, it turned out to be significantly worse than expected, so the pound has already begun to fall, which could continue to the lower boundary of the sideways channel without reaching the upper limit.

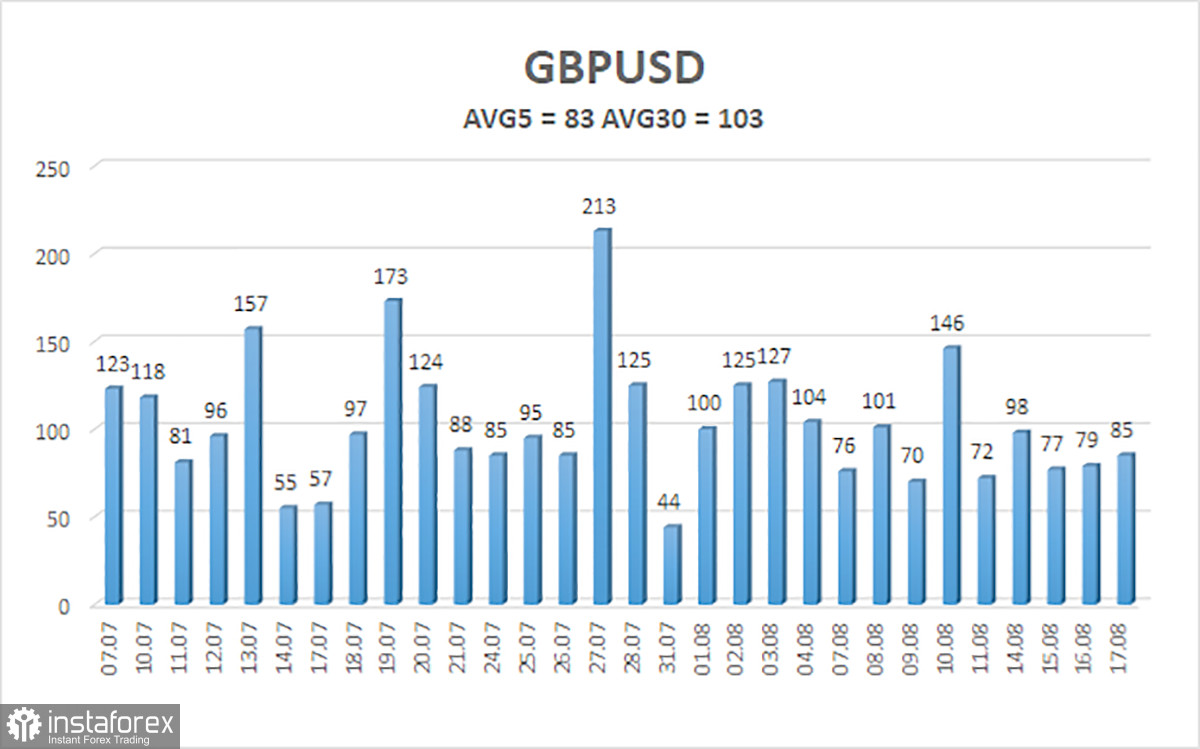
The average volatility of the GBP/USD pair over the last five trading days is 83 points. For the pound/dollar pair, this value is considered "medium." On Friday, August 18th, we thus expect movement within the range limited by levels 1.2664 and 1.2828. A reversal of the Heiken Ashi indicator downwards will signal the start of a downward movement within the sideways channel.
Nearest support levels:
S1 – 1.2726
S2 – 1.2695
S3 – 1.2665
Nearest resistance levels:
R1 – 1.2756
R2 – 1.2787
R3 – 1.2817
Trade recommendations:
The GBP/USD pair in the 4-hour timeframe has settled above the moving average, but overall we still have a sideways trend. Trading can now be based on a rebound from the upper (1.2787) or lower (1.2634) boundaries of the sideways channel, but reversals can also occur around them. The moving average may be crossed very often, which does not necessarily indicate a change in trend.
Explanations for illustrations:
Linear regression channels help determine the current trend. If both are pointing in the same direction, the trend is strong.
Moving average line (settings 20.0, smoothed) determines the short-term trend and the direction in which trading should be conducted.
Murrey levels are target levels for movements and corrections.
Volatility levels (red lines) are the likely price channel the pair will spend the next day, based on current volatility indicators.
CCI indicator - its entry into the oversold area (below -250) or the overbought area (above +250) indicates that a trend reversal in the opposite direction is approaching.
 English
 Русский
 Bahasa Indonesia
 Bahasa Malay
 ไทย
ไทย Español
 Deutsch
 Български
 Français
 Tiếng Việt
 中文
中文 বাংলা
বাংলা हिन्दी
 Čeština
 Українська
 Română

