On Thursday, the AUD/USD pair hit a 10-month price low, reaching the 0.6368 mark. This year, sellers of AUD/USD visited the 63rd figure area for the first time – the last time the pair was in this area was in the fall of 2022. In just a few hours of Thursday's Asian trading session, the aussie fell by 70 points. The direct reason for such a move was the "Australian Nonfarms". All components of the crucial economic report came out in the "red," reflecting unhealthy trends in Australia's labor market. This twist has added to AUD woes – not only against the greenback but across the entire market.

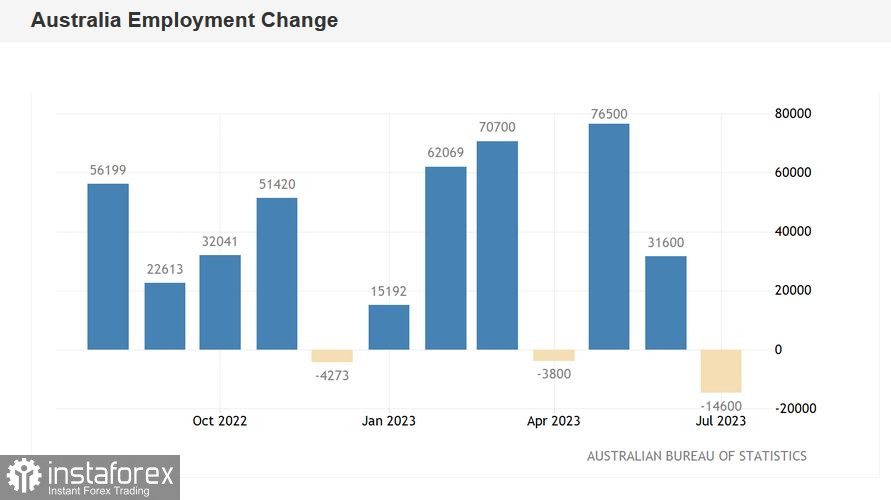
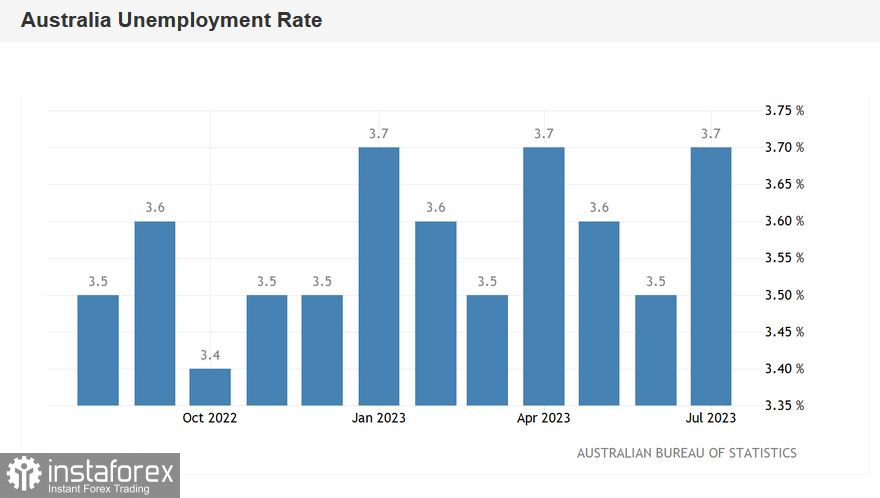
The unemployment rate slightly rose to 3.7% compared with optimistic expectations of 3.6%. The growth in the number of employed people was also disappointing. The Australian economy only created 14,600 jobs in July, compared with forecasts of 15,000. Take note that this indicator was in positive territory in May and June, but July's result turned out to be the worst since December 2022. Moreover, the negative dynamic in the number of employed people in July was due to a decline in the full-time employment component. In contrast, the part-time employment indicator showed a relatively decent result. While part-time employment increased by 9,600, the full employment component decreased by 24,200. I would like to remind you that Reserve Bank of Australia Governor Philip Lowe has repeatedly stated that such an imbalance is a negative thing. After all, full-time positions imply a higher level of wages and a higher level of social security compared to temporary part-time jobs. Hence, the decline in consumer activity among Australians and weak inflation growth.
The report also reflected a decrease in the proportion of the economically active population as the participation rate decreased to 66.7%. This indicator has been showing a downtrend for the second consecutive month.
The soft jobs data represent another blow to the aussie. The data should be viewed holistically, in conjunction with other fundamental factors. Among them are the RBA's minutes, the inflation report, and the wage price index. All these reports turned out to be unfavorable for the Australian dollar. The weak labor market report merely complements the fundamental picture.
The minutes of the RBA's August meeting exerted significant pressure on the aussie, as it reflected dovish sentiment among RBA officials. One particular phrasing in the minutes stood out – that the current interest rate provides a reliable path for returning to the target inflation level. This is the main message of the document, reflecting the restrained attitude of the Australian central bank's members.
Alongside the RBA's minutes, an important inflation indicator was published in Australia – the wage price index. In the second quarter of this year, it unexpectedly dropped to 3.6%. And although the decline was marginal, the fact that it fell is important in itself, following several months (since the first quarter of 2021) of consecutive growth.
Lastly, there's the Consumer Price Index in Australia. The monthly CPI indicator rose 5.4% (an annual low) in the twelve months to June. Australia's CPI slowed down to 0.8% in Q2 2023, compared with forecasts of a decline to 1.0% after an increase of 1.4% in Q1). This is the weakest growth rate since 2021.


The latest data merely adds to the general picture, providing the RBA with yet another argument for keeping the interest rate at 4.1% next month. We should also consider the uncertainty of economic growth prospects against the backdrop of the sharp deterioration in China's economy and broadly balanced inflationary risks. All this combined allows us to assume that, as a result of the September meeting, the RBA will maintain a wait-and-see stance.
After the poor employment report, the AUD/USD pair plummeted to the 0.6368 mark but failed to break through the support level of 0.6370 (the lower line of the Bollinger Bands indicator on the daily chart). Sellers were quick to lock in profits, afterwards buyers took over, initiating a corrective pullback. In my opinion, you should prioritize short positions on the pair, as the aussie continues to be within a protracted downtrend (look at the daily and weekly charts of AUD/USD). The current fundamental backdrop favors further price declines.
The technical picture supports this as well. On the daily, weekly and monthly charts, the pair is between the middle and lower lines of the Bollinger Bands indicator. On the weekly chart, the Ichimoku indicator has formed a bearish "Parade of Lines" signal, which reflects an interest in short positions. Corrective upwards pullbacks should be viewed as an opportunity to enter shorts – with the first and, so far, the main target of 0.6370 (the lower line of the Bollinger Bands indicator on the daily chart).
 English
 Русский
 Bahasa Indonesia
 Bahasa Malay
 ไทย
ไทย Español
 Deutsch
 Български
 Français
 Tiếng Việt
 中文
中文 বাংলা
বাংলা हिन्दी
 Čeština
 Українська
 Română

