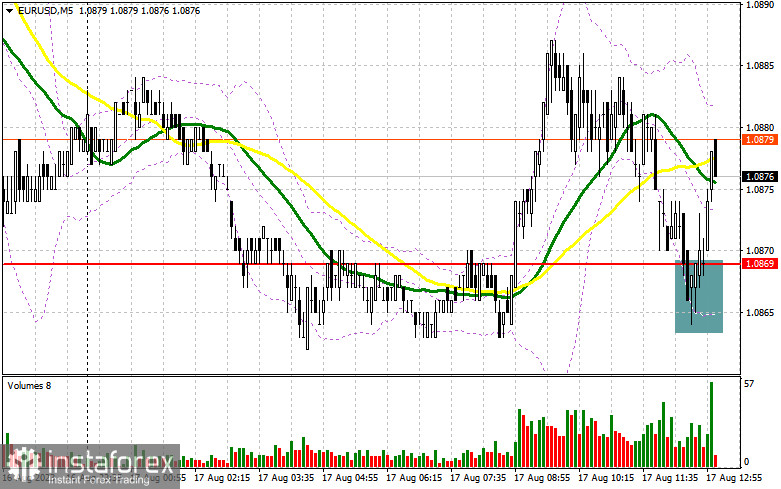
In my morning forecast, I paid attention to the level of 1.0869 and recommended making decisions on entering the market from it. Let's look at the 5-minute chart and see what happened there. The decline and a false breakdown at this level amid the empty economic calendar on the eurozone made it possible to generate a signal to buy the euro. However, EUR/USD has not yet developed a major growth due to low volatility and trading volume. The euro has the chance for growth until the moment when the instrument is traded above 1.0869. In the second half of the day, the technical picture changed only slightly.

What is needed to open long positions on EUR/USD
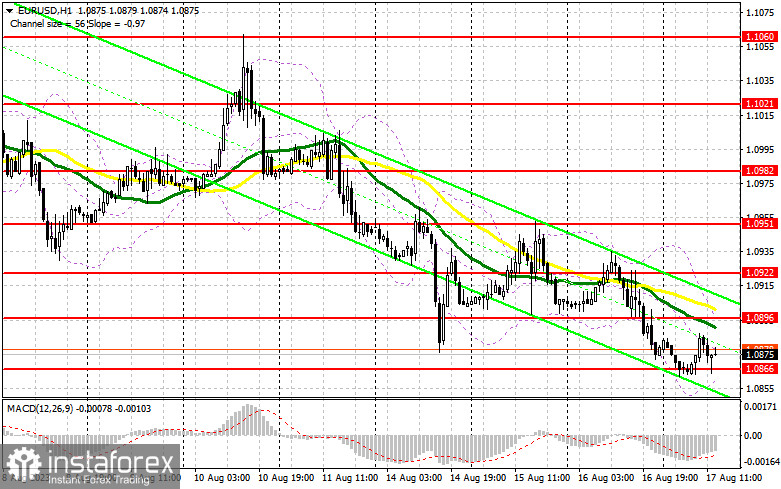
EUR/USD may again come under selling pressure during the US session after the release of statistics on initial jobless claims in the US and the manufacturing index by the Philadelphia Fed. A decrease in the number of claims for unemployment benefits is good for the US dollar and for the labor market. If so, EUR/USD will be able to follow yesterday's bearish scenario. For this reason, it is so important for buyers to stay above 1.0866, new support formed in the first half of the day. A false breakout at this level, by analogy with what I analyzed above, will provide a suitable entry point for buy positions during an upward correction in order to update the resistance at 1.0896, where the moving averages are on the side of the bears.
A break and a downward test of this range will boost the demand for the euro, giving a chance for a further upward correction and an updated high of 1.0922. The highest target remains the area of 1.0951, where I will take profits. With the option of EUR/USD decline and no activity at 1.0866 in the afternoon, which is a realistic scenario due to the development of the downtrend, the pressure on the instrument will only increase. In this case, only a false breakout in the area of the next support at 1.0836, a new one-month low, will give a signal to buy the euro. I will open long positions immediately on a dip from 1.0808, bearing in mind an upward correction of 30-35 pips within the day.
What is needed to open short positions on EUR/USD
The sellers made an effort, though without much success. Now I will act only on the condition of the growth and a false breakout in the area of the nearest resistance 1.0896. This price action will generate an excellent signal to sell in the continuation of the bear market and the fall of the pair to the new support area of 1.0866, formed in the first half of the day. A sell signal will be confirmed only after a breakout and consolidation below this range, as well as a reverse test from the bottom up, opening a direct road to a new low at 1.0836. The lowest target will be the area of 1.0808, which will indicate a further bearish trend. I will take profit there. If EUR/USD moves up during the American session and there are no bears at 1.0896, which cannot be ruled out, the bulls will try to return to the market again. With this market development, I will postpone short positions until the next resistance at 1.0922. You can also sell there, but only after an unsuccessful consolidation. I will open short positions immediately on a rebound from the high of 1.0951 with the aim of a downward correction of 30-35 pips.

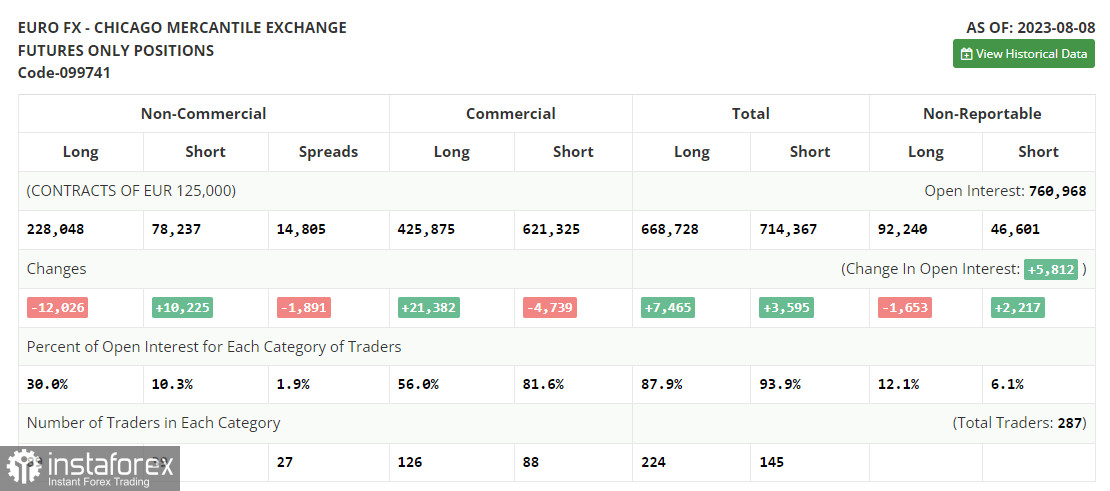
In the COT report (Commitment of Traders) for August 8, there was a decrease in long positions and an increase in short positions. All this happened before the release of important data on inflation in the US, which, in theory, should have helped determine the future policy of the Federal Reserve. However, this did not happen, as prices in the US rebounded again in July this year, maintaining the preconditions for further rate hikes by the regulator. However, the fall of the euro is a rather attractive moment, because, despite this, the reasonable medium-term strategy in the current environment remains to buy risky assets on their decline. The COT report shows that long non-commercial positions decreased by 12,026 to 228,048, while short non-commercial positions grew by 10,225 to 78,237. As a result, the spread between long and short positions shrank by 1,891. EUR/USD closed last week lower at 1.0981 against 1.0999 a week earlier.
Indicators' signals
Moving Averages
The instrument is trading below the 30 and 50-day moving averages. It indicates a further decline in the currency pair.
Note: The period and prices of the moving averages are considered by the analyst on the 1-hour chart and differ from the general definition of classic daily moving averages on the daily chart.
Bollinger Bands
In case EUR/USD goes up, the indicator's upper border around 1.0896 will act as resistance.
Description of indicators
- Moving average (moving average, determines the current trend by smoothing out volatility and noise). Period 50. It is marked yellow on the chart.
- Moving average (moving average, determines the current trend by smoothing out volatility and noise). Period 30. It is marked green on the chart.
- MACD indicator (Moving Average Convergence/Divergence — convergence/divergence of moving averages) Quick EMA period 12. Slow EMA period to 26. SMA period 9
- Bollinger Bands (Bollinger Bands). Period 20
- Non-commercial speculative traders, such as individual traders, hedge funds, and large institutions that use the futures market for speculative purposes and meet certain requirements.
- Long non-commercial positions represent the total long open position of non-commercial traders.
- Short non-commercial positions represent the total short open position of non-commercial traders.
- Total non-commercial net position is the difference between short and long positions of non-commercial traders.
 English
 Русский
 Bahasa Indonesia
 Bahasa Malay
 ไทย
ไทย Español
 Deutsch
 Български
 Français
 Tiếng Việt
 中文
中文 বাংলা
বাংলা हिन्दी
 Čeština
 Українська
 Română

