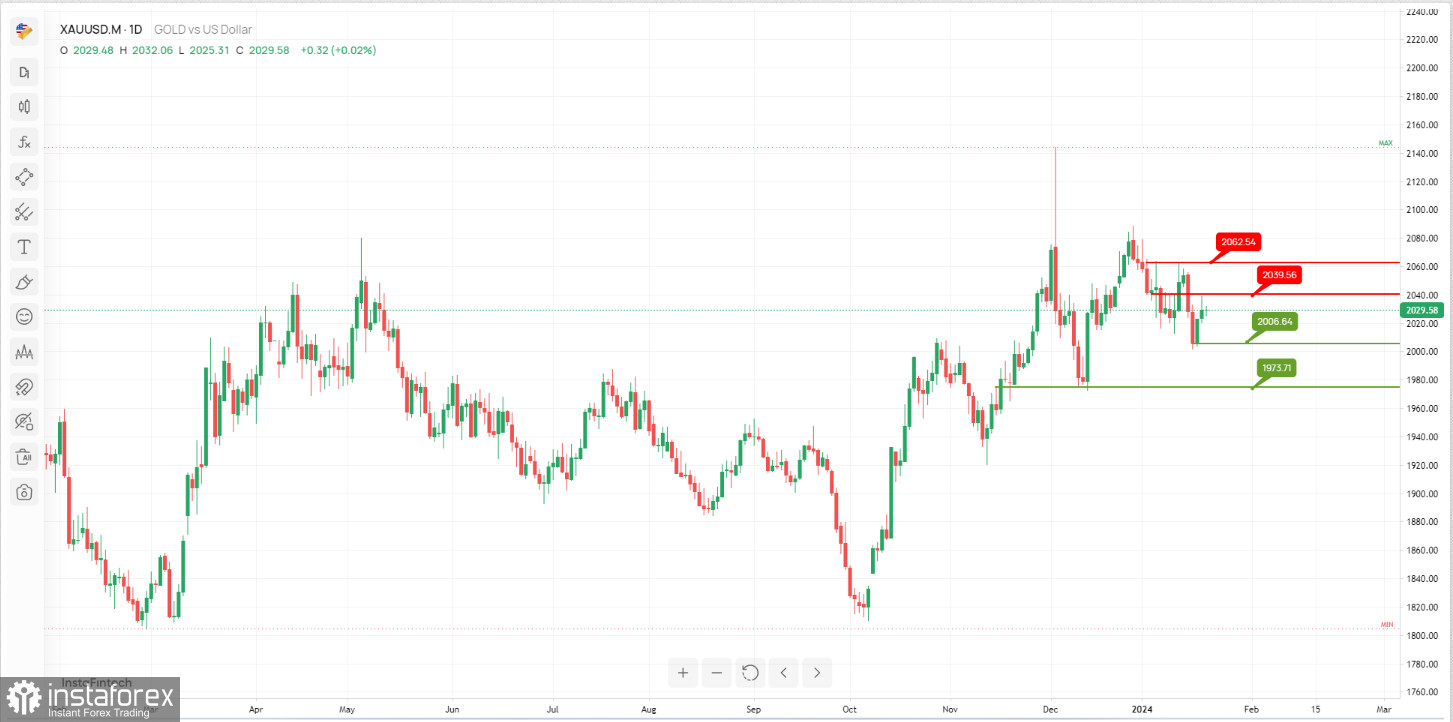
The XAU/USD (Gold/US Dollar) chart suggests a potential bullish continuation scenario with key support and resistance levels as follows:
Resistance Levels:
The 1st resistance level at 2039.56 is marked as "An Overlap resistance." This level represents a potential barrier to further upward movement in the XAU/USD exchange rate.
The 2nd resistance level at 2062.54 is identified as "Multi-swing high resistance." It is another significant resistance zone that traders should pay attention to.
Support Levels:
The 1st support level at 2006.64 is characterized as "Swing low support." This level may act as a support zone where price pullbacks or bounces could occur.
The 2nd support level at 1975.83 is labeled as "An Overlap support." It represents another important support zone where traders might consider entering long positions.
 English
 Русский
 Bahasa Indonesia
 Bahasa Malay
 ไทย
ไทย Español
 Deutsch
 Български
 Français
 Tiếng Việt
 中文
中文 বাংলা
বাংলা हिन्दी
 Čeština
 Українська
 Română

