The pound, paired with the dollar, was on the rise today, responding to the release of data on inflation growth in the United Kingdom. Some (though far from all) components of the report ended up in the green zone, prompting the pair to update nearly a week-long price peak, rising to 1.2765. Undoubtedly, today's report does not contribute to the weakening of the British currency.

However, caution should be exercised regarding the upward dynamic of GBP/USD. The situation is ambiguous, particularly in light of labor market data published on Tuesday.
Inconsistent Inflation
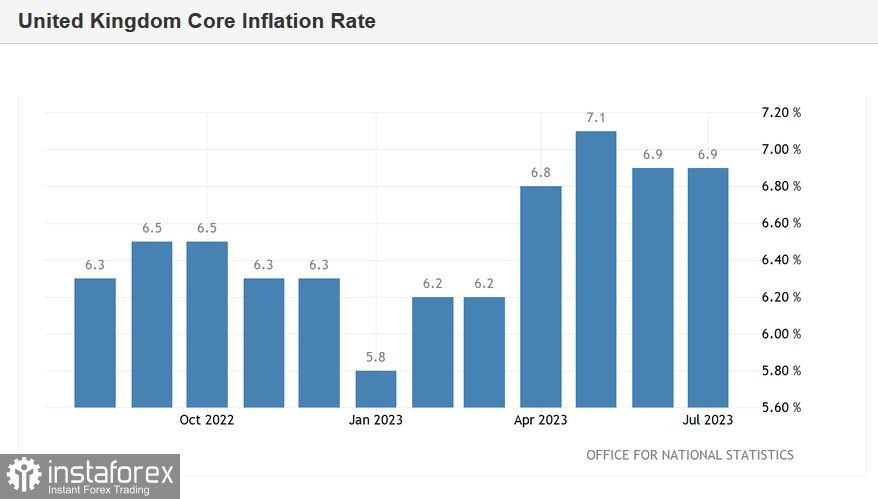
According to preliminary forecasts, all components of the inflation release were expected to reflect a slowdown in British inflation. Indeed, that is essentially what happened, with the exception of the core Consumer Price Index (CPI), which remained at the previous month's level. The core CPI reached its peak at 7.1% in May, then declined slightly to 6.9% in June, and came out at the same level in July.
All other components of the report reflected a slowdown in inflation, but most did not match the forecasted values. Some were in the green, others were in the red. But, again, all of them confirmed a decrease in inflation in the UK.
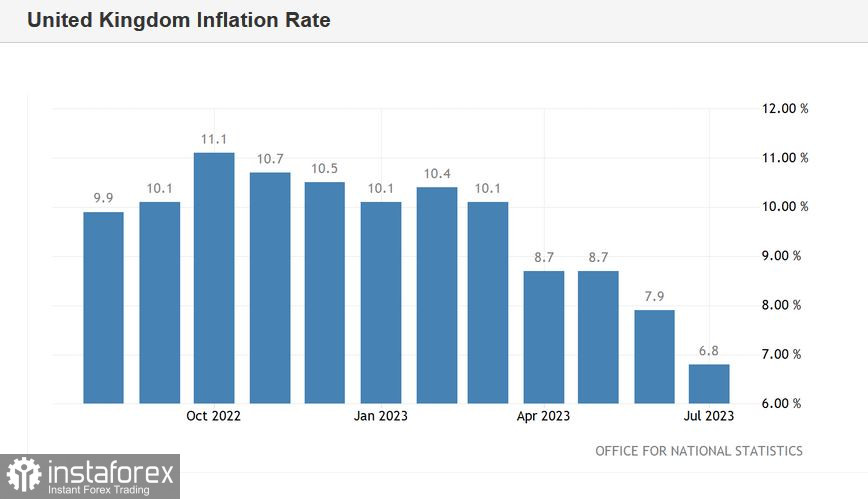
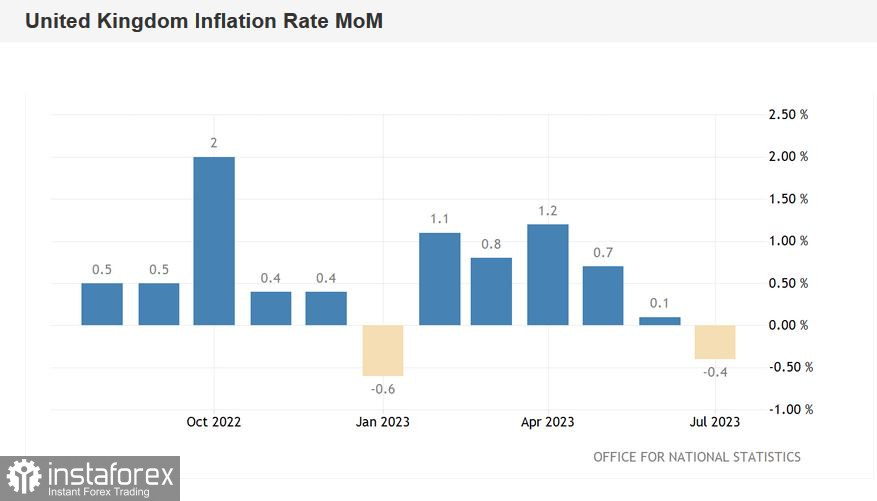
For example, the overall Consumer Price Index in monthly terms dropped to -0.4% (with a forecast decline to -0.5%). Although the figure ended up in the green zone, it has entered the negative area for the first time since January this year. In annual terms, the overall CPI fell to 6.8% (with a forecast decline to 6.7%), down from a previous value of 7.9%. Again – on the one hand, the actual result did not coincide with the forecast estimate, but on the other hand, 6.8% is the weakest growth rate of the indicator since February 2022.
The Retail Price Index fell to -0.6% (with a forecast drop to -0.7%). This report component has entered the negative area for the first time since January 2021. Moreover, this is the weakest result since February 2019. In annual terms, the figure was in the red zone, dropping to 9.0% (with a forecast drop to 9.1%, down from a previous value of 10.7%), the weakest growth rate since March 2022. Notably, this index is used by British employers when conducting wage negotiations.
The Purchasing Price Index of manufacturers similarly ended up in the red—both in annual and monthly terms. For example, in annual terms, the figure plummeted to -3.3% (with a forecast drop to -3.1%). The indicator has come out below zero for the second month in a row—the July result is the worst since August 2020.
What does the inflation data tell us?
As we can see, there is no need to talk about an acceleration of inflation growth in the UK. The only cause for concern is perhaps the core consumer price index, which remained at the June level in July. Plus, there is the pro-inflation wage indicator: according to data published yesterday, the level of average earnings in June grew by 8.2% (including bonuses)—the indicator has been growing consistently for the fourth month in a row, reaching its highest level in June since August 2021. Excluding bonuses, wages grew by 7.8%—a record increase since this indicator began to be tracked in 2001.
At the same time, the unemployment rate in the UK unexpectedly increased to 4.2% in June, whereas most experts expected it to be at 4.0%, as it was in May. Another disappointing component of the report is the indicator of the increase in the number of claims for unemployment benefits, which came in at 29,000 (with a forecast increase of 19,000)—this is the worst result since February 2021.
Conclusions
The fundamental picture for the GBP/USD pair is contradictory. Traders interpreted today's release in favor of the British currency, putting together, so to speak, the core CPI and wage indicators. And although other inflation indicators show a downward movement (in many cases, quite active), market participants decided that the "glass is half full, not empty."


Against this background, the GBP/USD pair is trying to approach the resistance level of 1.2770 (the middle line of the Bollinger Bands indicator on the daily chart), responding to the increase in hawkish expectations regarding the Bank of England's further actions.
Recall that at the last meeting, the head of the English regulator questioned the further increase in the interest rate, although he did not rule out such a scenario. Andrew Bailey "tied" the fate of the rate to the dynamics of key macroeconomic indicators. And since the main macro indicators of the UK have recently shown contradictory dynamics (minimal but still GDP growth in the second quarter, steady growth in industrial production, but at the same time an increase in the unemployment rate; a decrease in many inflation indicators, but at the same time growth in core CPI and wage indicators) – the intrigue remains.
That's why the GBP/USD pair's growth is so cautious. And that's why one should not rush to go long on the pair, at least until the price breaks through the 1.2770 resistance level. In such a case, the next target for the upward movement would be 1.2880 – at this price point, the Kijun-sen line coincides with the upper boundary of the Kumo cloud on the D1 timeframe. If buyers fail to overcome the aforementioned price barrier, bears will regain control of the pair, directing the price towards the 1.2650 support level (the lower line of the Bollinger Bands on the four-hour chart).
 English
 Русский
 Bahasa Indonesia
 Bahasa Malay
 ไทย
ไทย Español
 Deutsch
 Български
 Français
 Tiếng Việt
 中文
中文 বাংলা
বাংলা हिन्दी
 Čeština
 Українська
 Română

