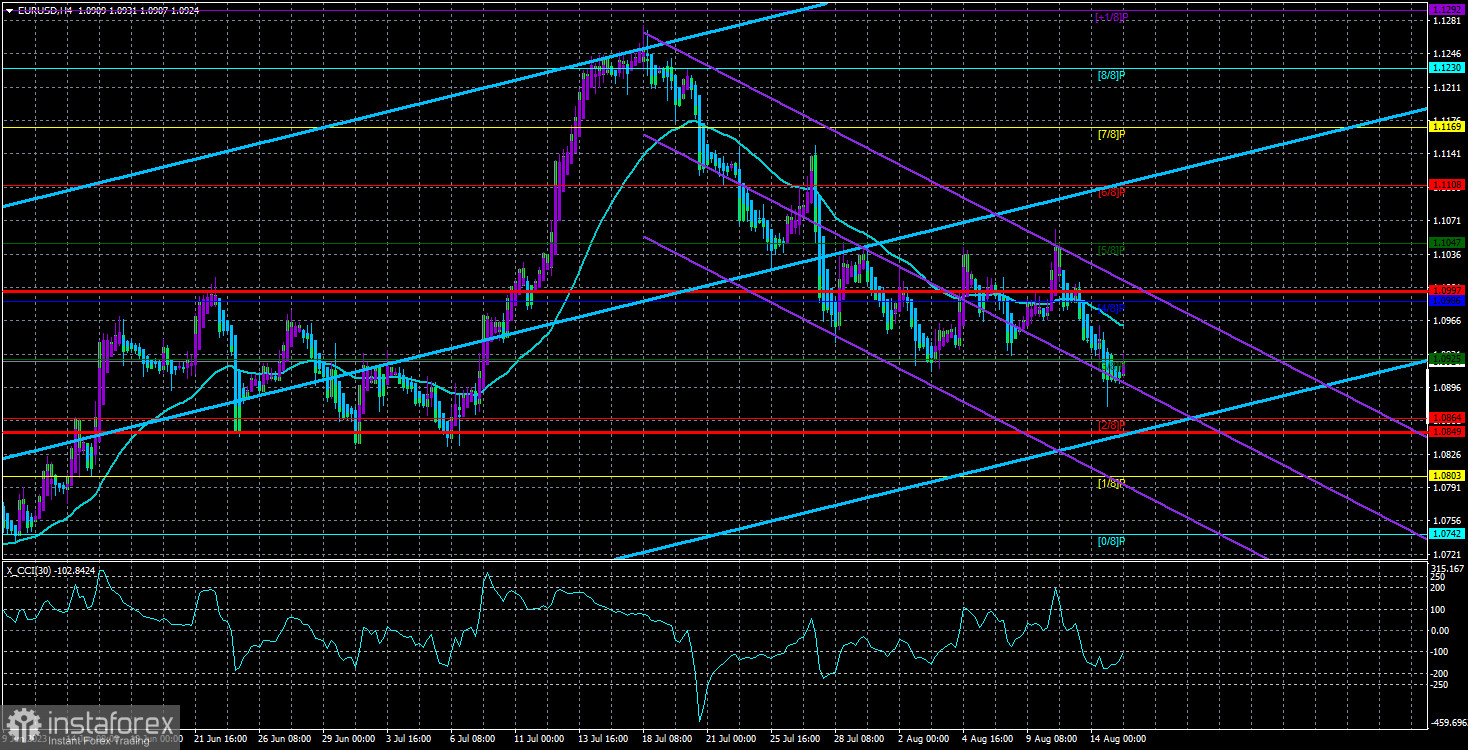
The EUR/USD currency pair traded lower for most of the day on Monday. When applied to a 4-hour timeframe, the Heiken Ashi indicator smooths out many intraday movements. In reality, there was also a period of growth for the pair during the previous day. However, in the 4-hour timeframe, the pair only declined throughout the day. And it must be said that this is very good.
What do we have from a technical perspective at the moment? The pair has actively tried to correct the newly initiated downward trend in the last two weeks. However, twice it failed to overcome the Murrey level of "5/8"-1.1047. Therefore, the correction ended quite quickly, and the downward movement resumed. The current drop in quotes may also end quickly because any movements are possible in the foreign exchange market. Nevertheless, important fundamental or macroeconomic events are required for a sharp change in trend. And there are none at the moment, nor are they expected this week.
In the "week preview," we said there would be quite a few reports this week, but most of them are unlikely to provoke any market reaction. Therefore, we don't see why the bears might retreat from the market. They will likely not press too hard on the pair, so we expect a gradual decline in the euro with frequent corrections and pullbacks.
In the 24-hour timeframe, the pair has almost reached the Senkou Span B line, which we have repeatedly highlighted as the nearest target. A rebound from this line could trigger an upward correction. However, a steady downward movement may help pass this barrier painlessly. Consolidation below the daily timeframe's Ichimoku cloud will allow for a drop to the 5th or 6th level. We have also regularly mentioned these targets in recent months.
The GDP report won't help the euro.
Today, there will only be a few secondary reports in the European Union and the US. They may provoke a market reaction, but it is unlikely to be strong. Tomorrow, from this perspective, looks much more interesting. A GDP report will be published in the European Union. Despite this being the second of three possible estimates (meaning the least interesting), the market needs to understand the state of the alliance's economy. We do not expect any reaction to this report, but at the same time, minimal economic growth is better than no growth at all.
However, growth of 0.3% quarter-over-quarter will also be of little significance. For three quarters in a row, the EU economy has barely grown, which is both good and bad at the same time. It's good because the ECB rate may rise weaker than if a recession had already started. It isn't good because the economy isn't growing, and the ECB can't yet afford to pause or end the monetary tightening cycle. Essentially, this report and the current value for the second quarter do not affect the ECB's plans and, therefore, will not affect the euro. In the case of a strong surplus over the forecasted value, a report on industrial production could only support the euro for a short period.

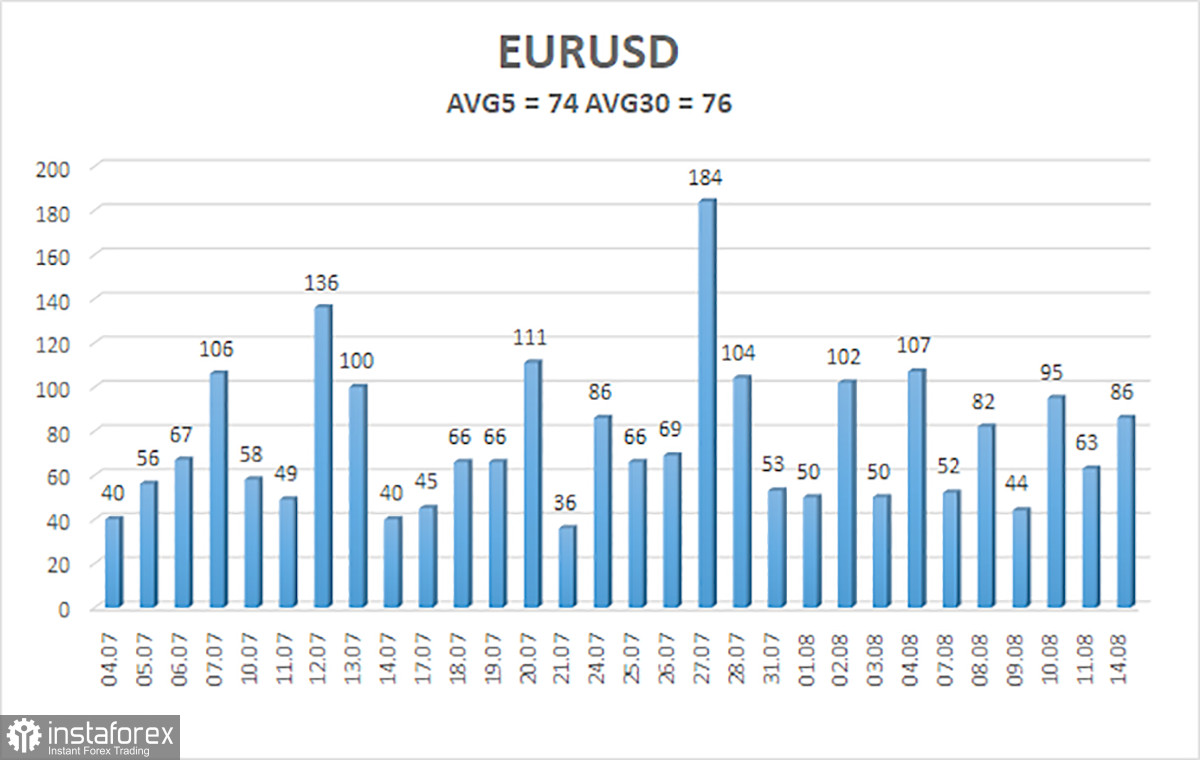
The average volatility of the euro/dollar currency pair over the last five trading days, as of August 15th, is 74 points and is characterized as "average." Therefore, we expect the pair to move between levels 1.0849 and 1.0997 on Tuesday. A reversal of the Heiken Ashi indicator upwards will indicate an upward correction.
The nearest support levels:
S1 – 1.0864
S2 – 1.0803
S3 – 1.0742
The nearest resistance levels:
R1 – 1.0925
R2 – 1.0986
R3 – 1.1047
Trading recommendations:
The EUR/USD pair is currently attempting to resume the downward trend. One can stay in short positions with targets at 1.0864 and 1.0849 until the Heiken Ashi indicator reverses upwards. Long positions can be considered if the price consolidates above the moving average with a target of 1.1047.
Explanations for the illustrations:
Linear regression channels - help determine the current trend. If both point in the same direction, the trend is strong.
Moving average line (settings 20.0, smoothed) - defines the short-term trend and direction in which to trade.
Murrey levels - target levels for movements and corrections.
Volatility levels (red lines) - the probable price channel in which the pair will spend the next day based on current volatility indicators.
CCI indicator - its entry into the oversold area (below -250) or the overbought area (above +250) indicates that a trend reversal in the opposite direction is approaching.
 English
 Русский
 Bahasa Indonesia
 Bahasa Malay
 ไทย
ไทย Español
 Deutsch
 Български
 Français
 Tiếng Việt
 中文
中文 বাংলা
বাংলা हिन्दी
 Čeština
 Українська
 Română

