Subtle Shifts in Ethereum's Market: A Technical Perspective
Overview of Current Market Scenario
Ethereum, a leading cryptocurrency, is currently experiencing a consolidation phase. This article delves into the technical aspects of the ETH/USD pair, offering insights into recent market movements and potential future directions.

Key Takeaways
- Consolidation Phase: Ethereum shows signs of consolidation with a -10% correction.
- Technical Indicators: Mixed signals from technical indicators and moving averages.
- Market Sentiment: Predominantly bullish sentiment, as reflected in recent data.
In-Depth Technical Analysis
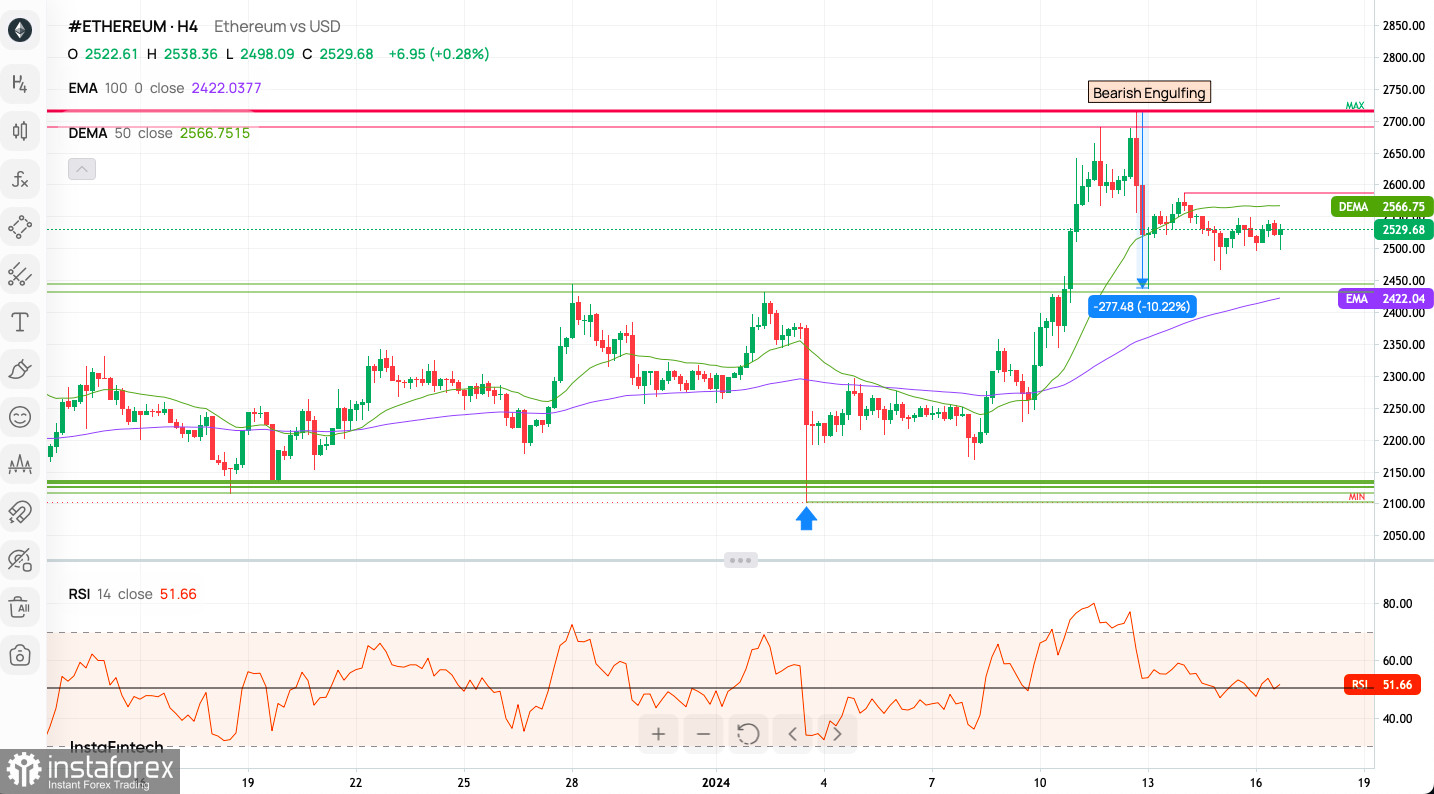
Ethereum's Price Movement: The ETH/USD pair witnessed a -10% correction post a Bearish Engulfing candlestick pattern, indicating a potential shift in market sentiment. The correction brought the price down from $2,715 to a support level around $2,347. The key resistance lies at $2,587, and a breakout above this could signal a bullish turn.
Intraday Technical Indicators: The analysis of 23 technical indicators reveals a mix of buy (10), sell (4), and neutral (9) signals. Similarly, 18 moving averages show a divide between buy (10) and sell (8) signals.

Market Sentiment Analysis: The sentiment scoreboard shows a strong bullish inclination, with an 81% bullish versus 19% bearish sentiment. This bullish trend has been increasing over the past week and the last three days.
Pivot Points:
WR3 - $2,631
WR2 - $2,568
WR1 - $2,545
Weekly Pivot - $2,506
WS1 - $2,482
WS2 - $2,443
WS3 - $2,380
Weekly Trading Insights for Long-Term Traders
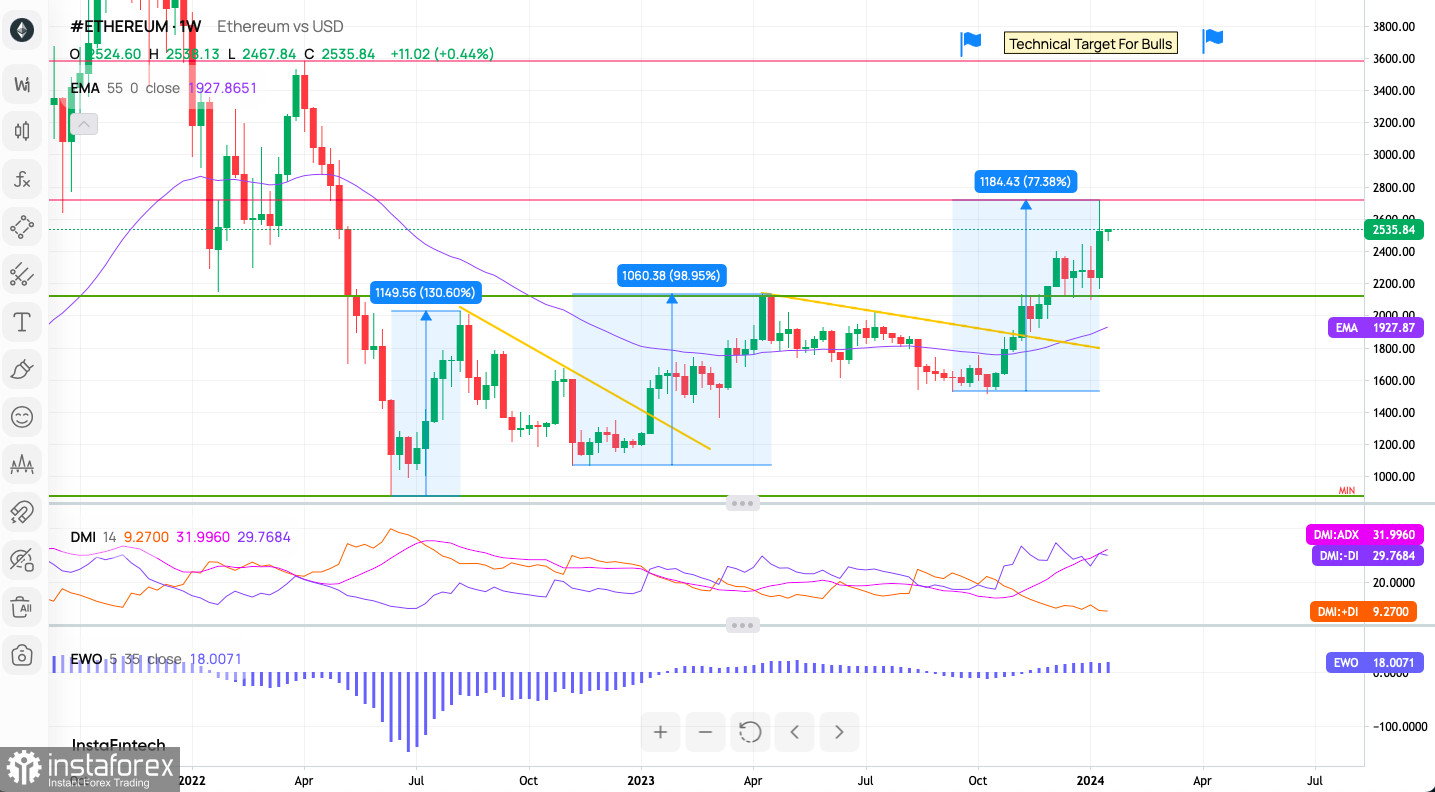
Price Projections: Historical price movements suggest a strong bullish phase in the past, with the current price action surpassing some of the smaller projection targets.
EMA 55 Analysis: The Exponential Moving Average (EMA) 55, currently at 1927.87, has previously acted as dynamic resistance. The price being above the EMA hints at a potential bullish trend.
Directional Movement Index (DMI): The DMI indicates a strong
bullish trend with the positive directional movement (DI+) above the negative (DI-). The Average Directional Index (ADX) being above 20 further confirms the strength of this trend.
Elliott Wave Oscillator (EWO): The oscillator shows bars above the zero line, indicating bullish momentum and suggesting that the market might be in an impulsive wave upwards.
Support and Resistance Levels: The chart indicates a significant support level marked as 'MIN'. The current price being well above this level reinforces the bullish sentiment in the market.

Conclusion
Scenario for Bulls: If Ethereum continues to maintain its position above key resistance levels and indicators such as the EWO and DMI remain positive, the bullish trend might strengthen. This could lead to a potential upward movement, especially if the price breaks through and holds above the current resistance zone.
Scenario for Bears: Conversely, if Ethereum fails to surpass the resistance level, it may enter a consolidation phase or experience a price retracement. Traders should watch for any changes in the technical indicators that might signal a shift in market sentiment or trend strength.
Useful Links
Important Notice
The begginers in forex trading need to be very careful when making decisions about entering the market. Before the release of important reports, it is best to stay out of the market to avoid being caught in sharp market fluctuations due to increased volatility. If you decide to trade during the news release, then always place stop orders to minimize losses.
Without placing stop orders, you can very quickly lose your entire deposit, especially if you do not use money management and trade large volumes. For successful trading, you need to have a clear trading plan and stay focues and disciplined. Spontaneous trading decision based on the current market situation is an inherently losing strategy for a scalper or daytrader.
 English
 Русский
 Bahasa Indonesia
 Bahasa Malay
 ไทย
ไทย Español
 Deutsch
 Български
 Français
 Tiếng Việt
 中文
中文 বাংলা
বাংলা हिन्दी
 Čeština
 Українська
 Română

