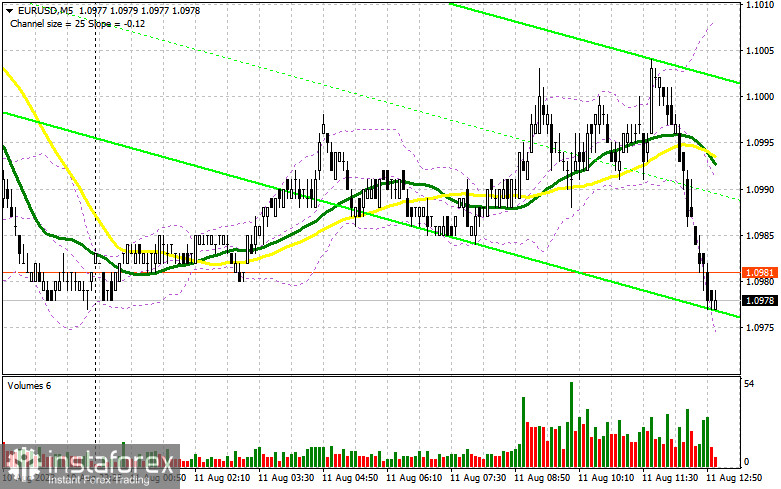
In my morning forecast, I drew attention to the 1.1013 level and advised making trading decisions based on it. Let's delve into the 5-minute chart and see what transpired there. There was a rise, but due to the market's low volatility, it didn't quite reach the indicated area. As a result, no suitable entry points were established. The technical picture remained unchanged for the latter part of the day.

To open long positions on EUR/USD, the following is required:
During the American session, more critical data related to inflation in the US is anticipated. If the Producer Price Index rises below market expectations, similar to yesterday, it could lead to a decent upward movement in the euro, which buyers are banking on. However, if US inflation exceeds economists' forecasts, the pressure on the euro will likely increase, leading to a more substantial drop. This could also benefit buyers as they would have an opportunity to enter at more attractive prices.
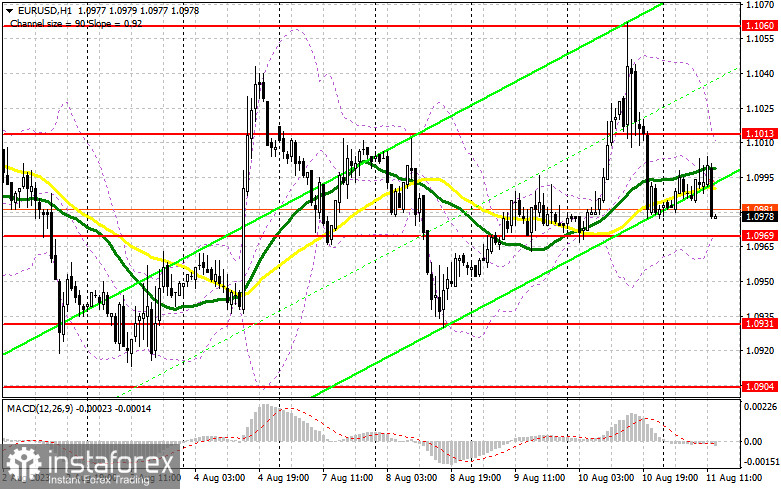
I prefer to act primarily based on the morning support of 1.0969. A decline and the formation of a false breakout at this level would signal to buy, aiming for an upward move to update the resistance at 1.1013. Given weak US inflation statistics, a breakout and top-down test of this range will boost demand for the euro, providing a chance to continue the upward trend and reach a high of 1.1060. The ultimate target remains at 1.1106, where I'll lock in profits. In case of a EUR/USD drop and lack of activity at 1.0969, which is quite possible, especially after yesterday's sharp euro sell-off, the bulls' enthusiasm could quickly fade by the week's end. In such a scenario, only the formation of a false breakout around the next support of 1.0931 would signal to buy the euro. I would initiate long positions immediately on a rebound from the low of 1.0904, aiming for an upward correction of 30-35 points within the day.
To open short positions on EUR/USD, the following is required:
Sellers today have chances to maintain the bearish market, but for this, they need to defend the new resistance at 1.1013 and take over the support at 1.0983. I will act only after the formation of a false breakout around 1.1013, which may occur due to the weak report on the producer prices in the United States. This will lead to the pair dropping to the nearest support at 1.0969. Only after breaking through and settling below this range and a reverse test from the bottom up can we get a sell signal, opening a direct path to a minimum of 1.0931. The ultimate target will be the 1.0904 area, which will indicate the formation of a bearish trend. I will secure profits there. In case of an upward movement of EUR/USD during the American session and the absence of bears at 1.1013, which cannot be ruled out, the bulls will try to re-enter the market. If such a turn of events unfolds, I will delay short positions to the next resistance of 1.1060. I can also sell there, but only after an unsuccessful settlement. I will open short positions immediately on a rebound from a maximum of 1.1106, aiming for a downward correction of 30-35 points within the day.


Indicator signals:
Moving Averages:
Trading is conducted around the 30 and 50-day moving averages, indicating market uncertainty.
Note: The author considers the period and prices of moving averages on the hourly chart H1 and differ from the general definition of classical daily moving averages on the daily chart D1.
Bollinger Bands:
In case of growth, the upper border of the indicator around 1.1013 will act as resistance.
Description of indicators:
• Moving average (defines the current trend by smoothing volatility and noise). Period 50. Marked in yellow on the chart.
• Moving average (defines the current trend by smoothing volatility and noise). Period 30. Marked in green on the chart.
• MACD Indicator (Moving Average Convergence/Divergence). Fast EMA with a period of 12. Slow EMA with a period of 26. SMA with a period of 9.
• Bollinger Bands. Period 20.
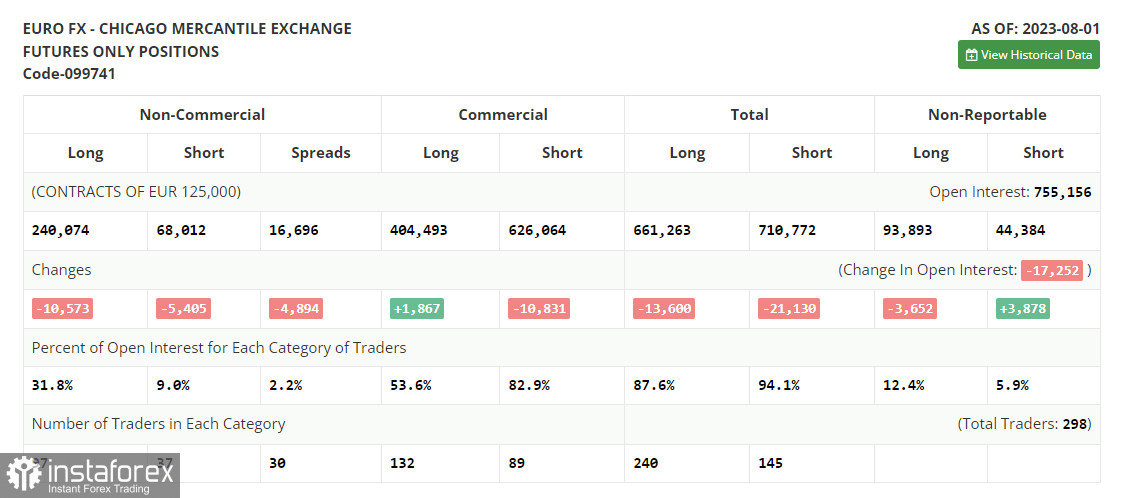
• Non-commercial traders - speculators, such as individual traders, hedge funds, and large institutions, who use the futures market for speculative purposes and meet certain requirements.
• Long non-commercial positions represent the total long open position of non-commercial traders.
• Short non-commercial positions represent the total short open position of non-commercial traders.
• The total non-commercial net position is the difference between non-commercial traders' short and long positions.
 English
 Русский
 Bahasa Indonesia
 Bahasa Malay
 ไทย
ไทย Español
 Deutsch
 Български
 Français
 Tiếng Việt
 中文
中文 বাংলা
বাংলা हिन्दी
 Čeština
 Українська
 Română

