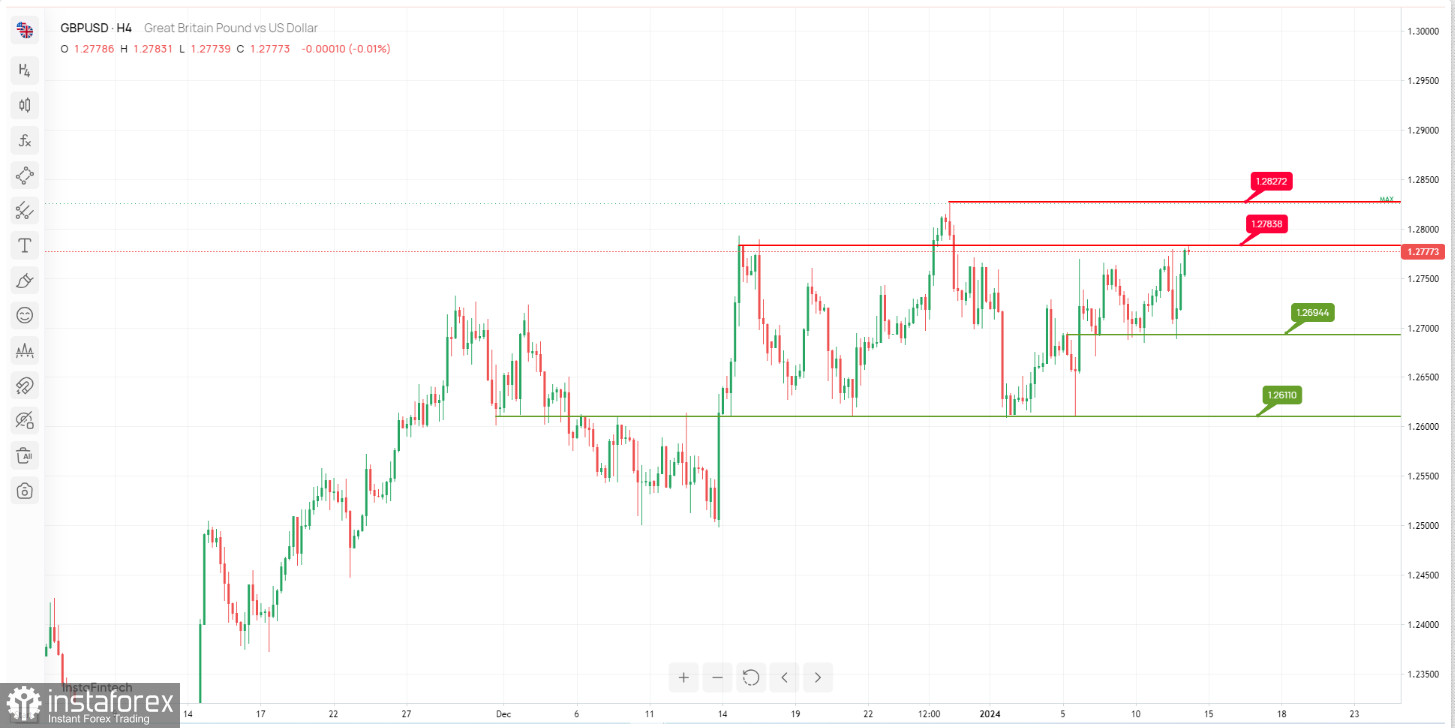
The GBP/USD chart indicates the potential for a bearish reversal, with significant resistance and support levels in play.
Resistance Levels:
The 1st resistance level at 1.27838 is labeled as "An Overlap resistance," signifying a critical level where selling pressure may emerge, potentially causing a reversal or price consolidation.
The 2nd resistance at 1.28130 is characterized as "Swing high resistance," reinforcing its importance as a barrier to further upward price movement.
Support Levels:
The 1st support level at 1.26944 is identified as "An Overlap support." This level suggests a potential area where buying interest may surface, acting as a crucial support zone.
The 2nd support at 1.26110 is also labeled as "An Overlap support," strengthening its significance as a support zone.
 English
 Русский
 Bahasa Indonesia
 Bahasa Malay
 ไทย
ไทย Español
 Deutsch
 Български
 Français
 Tiếng Việt
 中文
中文 বাংলা
বাংলা हिन्दी
 Čeština
 Українська
 Română

