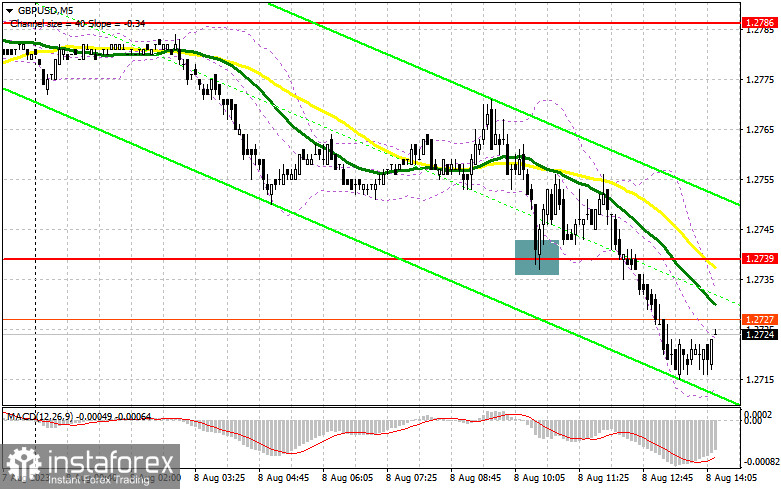
In my morning forecast, I highlighted the 1.2739 level and advised making market entry decisions based on it. Let's take a look at the 5-minute chart and see what happened there. A decrease and the formation of a false breakout at this level generated a signal to buy the pound, which momentarily resulted in an upward movement of only 10 points. It didn't evolve into a more significant upward surge, and on the second attempt, the bears broke below 1.2739. The technical outlook was completely revised for the second half of the day.

To open long positions on GBP/USD, it is necessary to:
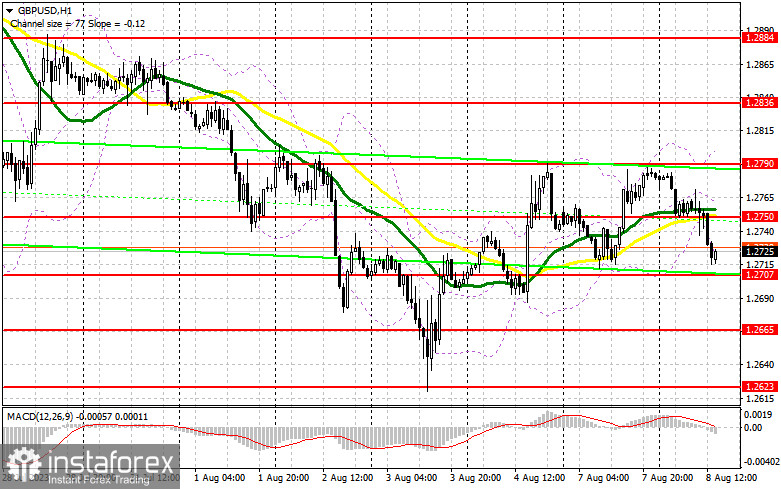
The American session will still focus on the speeches of representatives of the Federal Reserve System, scheduled for the second half of the day. We expect speeches from FOMC members Patrick T. Harker and Thomas Barkin, which, similar to yesterday, might lead to a rise in the pound. Hence, only in the case of strong statistics on the NFIB small business optimism indicator and the trade balance will I anticipate a further decline in GBP/USD to the new support area of 1.2707, where I expect large players to show their hands. The formation of a false breakout at this level will provide a good entry point for long positions, leading to a surge towards the resistance area of 1.2750, where the moving averages are, siding with the bears. A breakout and consolidation above this range give a chance to establish a bullish market with a renewal of 1.2790. The ultimate target would be the resistance at 1.2836, where I'd recommend taking profits. In the scenario where there's a decline to 1.2707 and no buyers in the second half of the day, the pressure on the pound will increase. In such a case, only the defense of the next area at 1.2665, and a false breakout on it, will signal the opening of long positions. I plan to buy GBP/USD immediately on a rebound only from the minimum of 1.2623, with a correction target of 30-35 points within the day.
To open short positions on GBP/USD, the requirements are:
While trading remains below 1.2750, further pound depreciation can be expected. In the event of a GBP/USD surge after speeches from the Federal Reserve representatives, like yesterday, only a failed consolidation above 1.2750 will signal a sell with the prospect of dropping to the 1.2707 support. A breakout and a bottom-up retest of this range will deliver a more significant blow to buyers' positions, offering a chance for a more significant GBP/USD decline to 1.2665. The ultimate target will be the low of 1.2623, where I will lock in profits. If GBP/USD rises and there's no activity at 1.2750 in the second half of the day, trading will remain within the lateral channel, and the bulls will have a chance to establish an upward correction to 1.2790. Only a false breakout at this level will provide an entry point for short positions. If there's no downward movement, I will sell the pound immediately on a bounce from 1.2836, aiming only for a pair's downward correction of 30-35 points within the day.

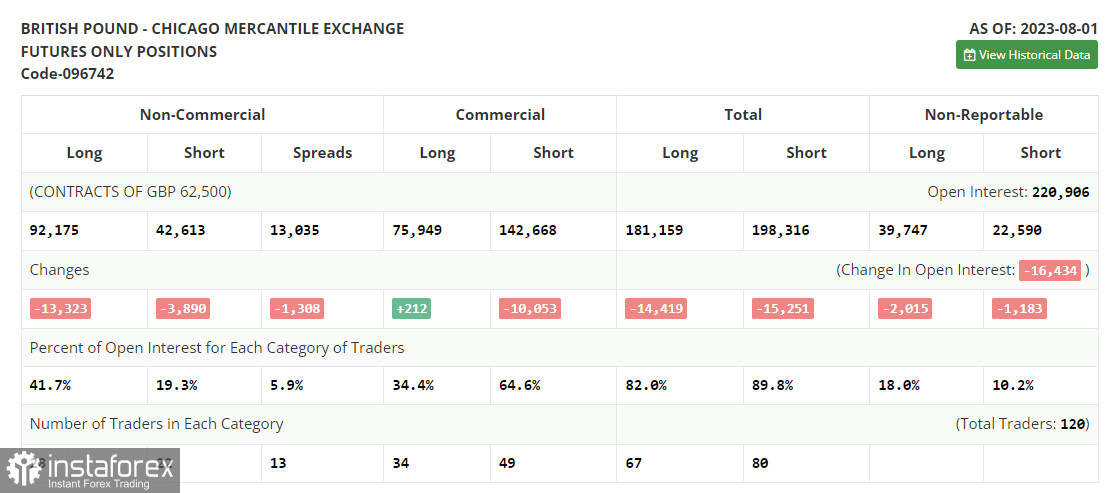
In the COT report (Commitment of Traders) for August 1st, there was a reduction in both long and short positions. Traders closed positions ahead of the important Bank of England meeting, which, despite recent decisions by the Federal Reserve and the European Central Bank, signaled to maintain an aggressive policy to combat high inflation. The new report doesn't consider changes made after the regulator's meeting, so it can be somewhat overlooked. We anticipate significant UK GDP data on which the Bank of England will base its future decisions. However, as before, the optimal strategy remains buying the pound on declines, as the difference in central bank policies will influence the prospects of the US dollar, exerting pressure on it. The latest COT report states that long non-commercial positions declined by 13,323 to 92,175, while short non-commercial positions dropped by 3,890 to 42,613. Consequently, the spread between long and short positions narrowed by 1,308. The weekly price dropped and stood at 1.2775 compared to 1.2837.

Indicator signals:
Moving Averages:
Trading is conducted below the 30 and 50-day moving averages, indicating bears' attempts to re-enter the market.
Note: The author considers the moving average periods and prices on the H1 hourly chart and differ from the general definition of classic daily moving averages on the D1 daily chart.
Bollinger Bands:
In the event of a decline, the lower boundary of the indicator, around 1.2735, will serve as support.
Description of indicators:
• Moving average (determines the current trend by smoothing volatility and noise). Period 50. Marked in yellow on the chart.
• Moving average (determines the current trend by smoothing volatility and noise). Period 30. Marked in green on the chart.
• MACD Indicator (Moving Average Convergence/Divergence). Fast EMA period 12. Slow EMA period 26. SMA period 9.
• Bollinger Bands. Period 20.
• Non-commercial traders - speculators, such as individual traders, hedge funds, and large institutions that use the futures market for speculative purposes and meet certain requirements.
• Long non-commercial positions represent the total long open position of non-commercial traders.
• Short non-commercial positions represent the total short open position of non-commercial traders.
• The total non-commercial net position is the difference between non-commercial traders' short and long positions.
 English
 Русский
 Bahasa Indonesia
 Bahasa Malay
 ไทย
ไทย Español
 Deutsch
 Български
 Français
 Tiếng Việt
 中文
中文 বাংলা
বাংলা हिन्दी
 Čeština
 Українська
 Română

