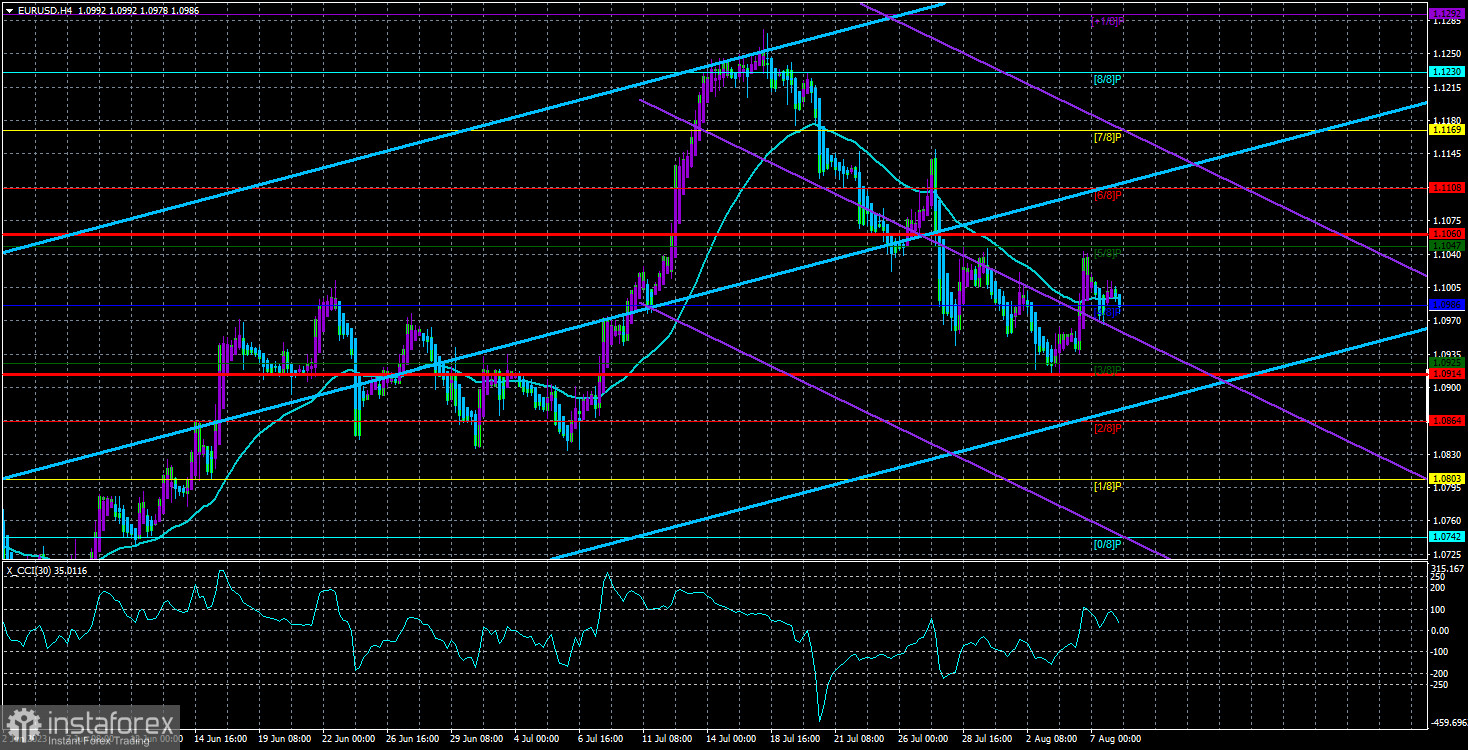
The EUR/USD currency pair almost didn't move the entire day on Monday. On the shorter timeframes, traders could notice some movement, but there was virtually none on the 4-hour chart. Moreover, on Friday, the price sharply rose, settled above the moving average, and reverted to it. On Monday, the price traded along the moving average, so at this point, it's even hard to tell where the pair stands relative to the moving average line. It's understood that Mondays are often semi-holidays. There were no significant macroeconomic reports yesterday, and statements from several Federal Reserve Monetary Committee representatives were needed to clarify future rate changes. Thus, this week could continue with a sluggish upward correction, or the downward trend could resume.
In the medium term, we certainly favor a downward trend. The euro has grown too strong and for too long, considering the entire fundamental background over the past ten months. Thus, the pair might even revert to price parity. However, by the end of the year, the dollar might face a new downside factor in the form of the Federal Reserve starting to ease its monetary policy. The market has yet to pay much attention in the last ten months to the regular rate hikes by the Federal Reserve, even though they increased more rapidly than the ECB rate. Hence, there could be a new reason for selling the dollar.
On the 24-hour timeframe, the pair continues to be below the critical line, which doesn't offer additional downward prospects. Only in 2023 did we observe several such consolidations, which didn't lead to any further decline.
The Federal Reserve may raise the rate once more this year.
Another inflation report will be released this Thursday in the States, which might be quite negative. At the last Federal Reserve meeting, it became clear that the regulator would closely evaluate the next two inflation reports and the labor market and unemployment reports. The first Non-Farm Payrolls have already been released and were weaker than forecast. However, not so weak as to make the Federal Reserve decide against additional tightening. This Thursday's inflation report might indicate an acceleration from 3% to 3.3%, and core inflation may remain at 4.8%. Such figures will likely increase the likelihood of a new policy tightening in September or October.
The Federal Reserve has long made it clear to the market that it does not intend to drag out the inflation issue for several years. Since the U.S. economy grows quarter by quarter and the labor market and unemployment data remain reasonably good, there are grounds and opportunities to continue raising rates in the States. Despite all the assurances by Jerome Powell and other central bank heads about the long-term impact of tightening on inflation, we currently observe that if the rate begins to grow slower, the inflation-slowing effect also decreases in a couple of months. The conclusion is straightforward: tightening must continue to ensure a return to 2%. An inflation report, if it indicates acceleration, might trigger the growth of the U.S. dollar, as the market would increase the likelihood of tightening in September.
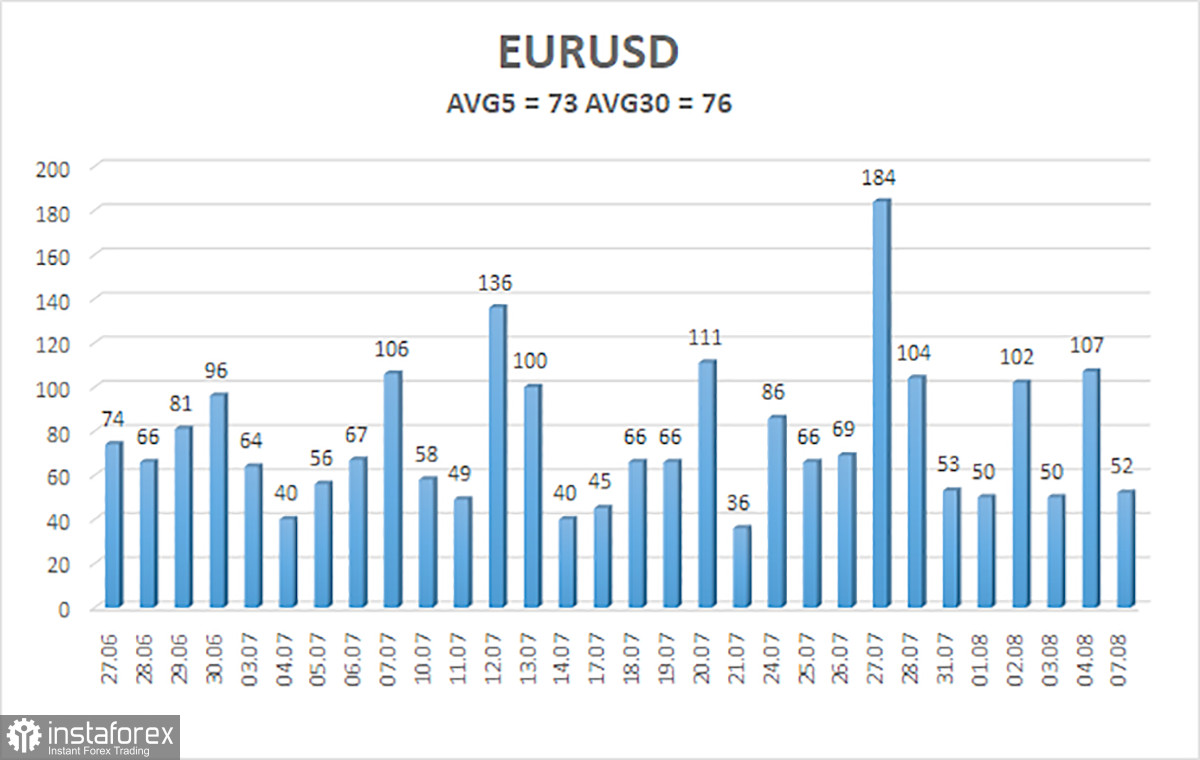
The average volatility of the euro/dollar currency pair over the last five trading days as of August 8 is 73 points and is characterized as "average." Thus, we expect the pair's movement to be between 1.0914 and 1.1060 on Tuesday. A downward turn of the Heiken Ashi indicator will signal a potential resumption of the downward movement.
Nearest support levels:
S1 – 1.0986
S2 – 1.0925
S3 – 1.0864
Nearest resistance levels:
R1 – 1.1047
R2 – 1.1108
R3 – 1.1169
Trading recommendations:
The EUR/USD pair has begun an upward correction, but the price is precisely on the moving average. Now, one can consider new long positions with targets of 1.1047 and 1.1060 in the event of a price bounce off the moving average and the 1.0986 level. Short positions will become relevant only after the price firmly establishes itself below the moving average line and the 1.0986 level, with targets of 1.0925 and 1.0914.
Explanations for the illustrations:
Linear regression channels - help determine the current trend. If both are directed in the same direction, the trend is strong.
Moving average line (settings 20.0, smoothed) - determines the short-term trend and the direction in which trading should be conducted.
Murray levels - target levels for movements and corrections.
Volatility levels (red lines) - the probable price channel in which the pair will spend the next day, based on current volatility indicators.
CCI Indicator - its entry into the oversold area (below -250) or the overbought area (above +250) indicates that a trend reversal in the opposite direction is approaching.
 English
 Русский
 Bahasa Indonesia
 Bahasa Malay
 ไทย
ไทย Español
 Deutsch
 Български
 Français
 Tiếng Việt
 中文
中文 বাংলা
বাংলা हिन्दी
 Čeština
 Українська
 Română

