Analysis of GBP/USD 5M

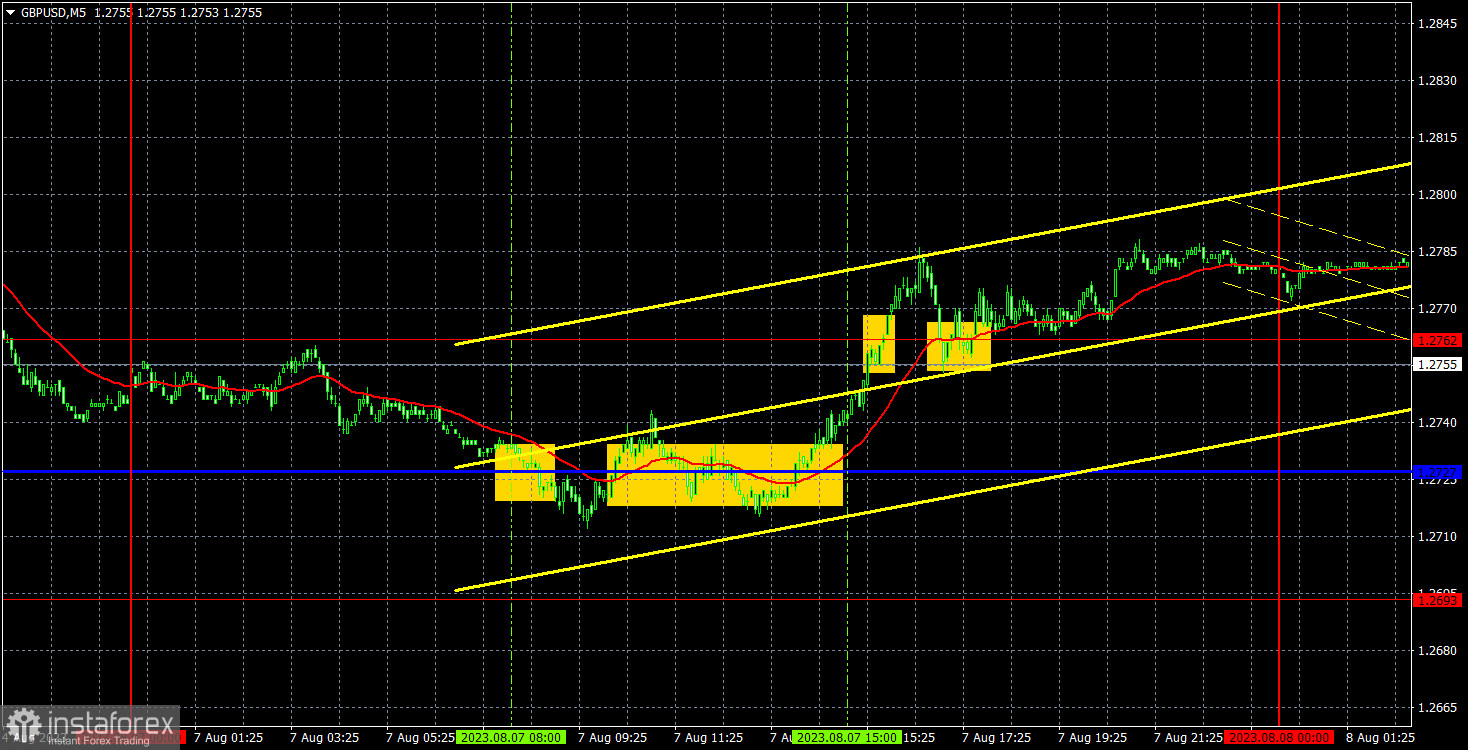
On Monday, the GBP/USD pair also showed quite erratic movements. The pair traded alongside no significant economic data so there was nothing that could influence traders' sentiment. As a result, we saw modest volatility and corrective movements. The levels and lines were practically ignored. Like the euro, the British pound may continue its corrective phase this week. We should not expect to see strong upward movements every day. There are hardly any important reports this week. The US inflation report may remain unchanged in July, and the UK's GDP has been stagnant at around 0% growth for four quarters. Therefore, we believe that these factors may hold back the sterling's growth, and in the medium-term perspective, a decline is possible.
Speaking of trading signals, they were mediocre on Monday. During the entire European session, the pair remained around the Kijun-sen line, constantly moving above and below it. Therefore, it was quite challenging to identify clear signals around this line. However, we had already warned you that Monday could present a flat market. Thus, it was difficult to determine entry points for positions. There were no clear signals at all. Traders could have opened one or two positions near the Kijun-sen line, with one position likely closing at a slight loss. The second position might have resulted in profit as the pair edged up in the afternoon.
COT report:

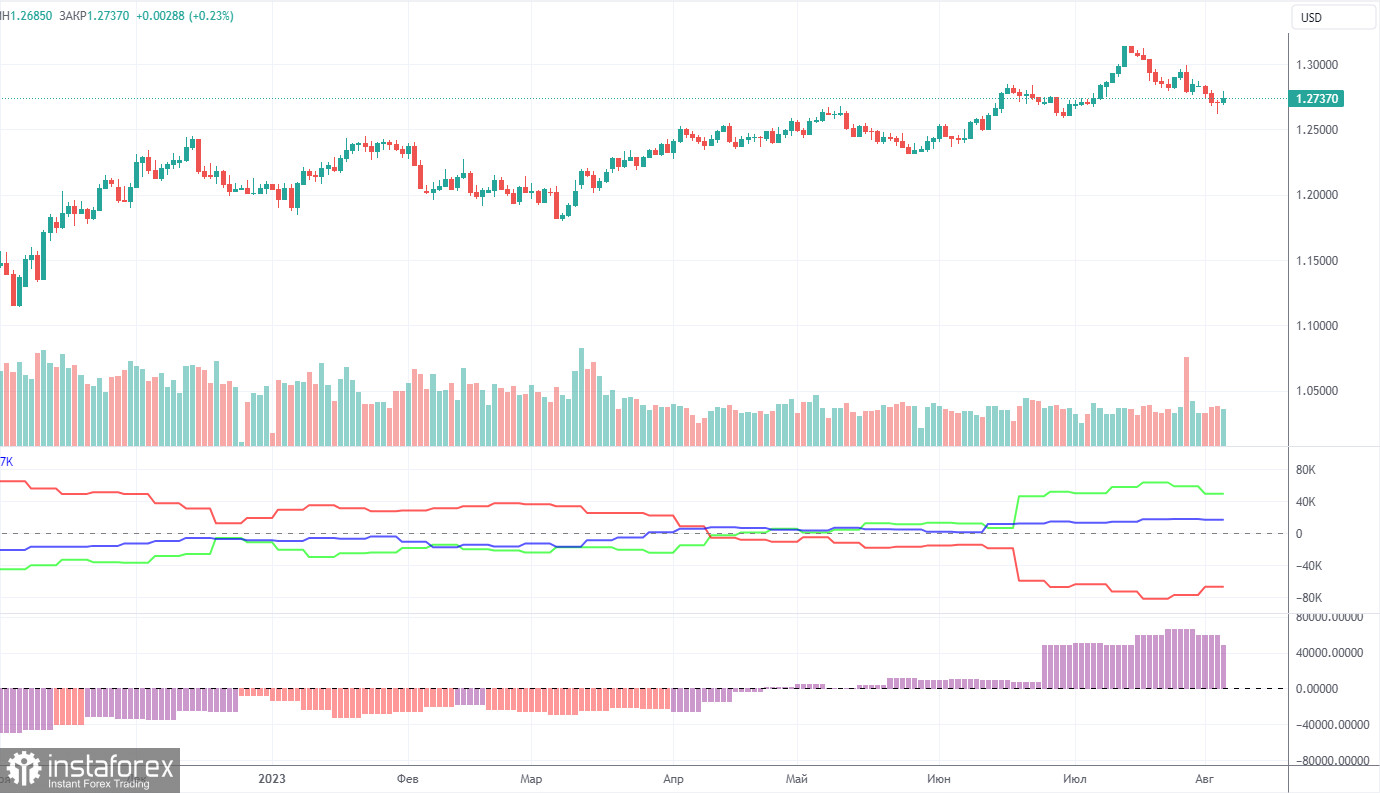
According to the latest report, the non-commercial group of traders closed 13,300 long positions and 3,800 short ones. Thus, the net position of non-commercial traders fell by almost 10,000 positions in a week. But in general, it is still rising. The net position has been steadily growing over the past 10 months as well as the pound sterling. Now, the net position has advanced markedly. This is why the pair will hardly maintain its bullish momentum. I believe that a long and protracted downward movement should begin. COT reports signal a slight growth of the British currency but it will not be able to rise in the long term. There are no drivers for opening new long positions and not many technical signals for short positions either.
The British currency has already grown by a total of 2,800 pips, from its absolute lows reached last year, which is a significant increase. Without a downward correction, the continuation of the uptrend will be illogical. However, there has been no logic in the pair's movements for quite some time. The market perceives the fundamental background one-sidedly, ignoring any data in favor of the dollar. The Non-commercial group of traders has opened 92,100 long positions and 42,600 short ones. I remain skeptical about the long-term growth of the pound sterling but speculators continue to buy and the pair continues to rise.
Analysis of GBP/USD 1H

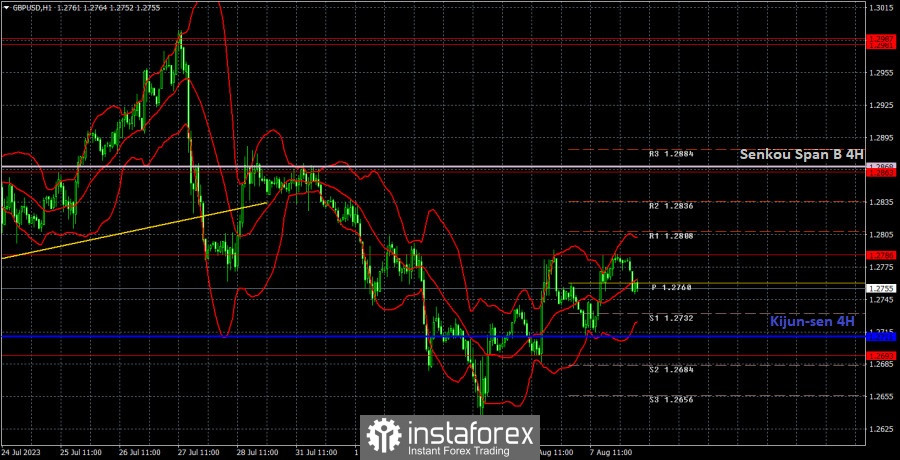
On the 1H chart, the pound/dollar pair has started to correct, but has not yet broken the downtrend. Consolidation below the critical line may signal a resumption of the downward movement. We insist that there are no grounds for the sterling's growth, so we expect the pair to fall further. Over the past two days, the pair has failed to break through a new level like 1.2786, increasing the chances of a downtrend.
On August 8, traders should pay attention to the following key levels: 1.2520, 1.2598-1.2605, 1.2693, 1.2786, 1.2863, 1.2981-1.2987, and 1.3050. The Senkou Span B line (1.2868) and the Kijun-sen line (1.2711) lines can also be sources of signals, e.g. rebounds and breakout of these levels and lines. It is recommended to set the Stop Loss orders at the breakeven level when the price moves in the right direction by 20 pips. The lines of the Ichimoku indicator can move during the day, which should be taken into account when determining trading signals. There are support and resistance levels that can be used to lock in profits.
Today, there are no important events or reports lined up in the UK and the US, except for a few speeches by Federal Reserve officials. However, it's a bit of a stretch to consider such things as important. Therefore, we expect calm movements akin to a flat and another low-volatility day.
Description of the chart:
Support and resistance levels are thick red lines near which the trend may end. They do not provide trading signals;
The Kijun-sen and Senkou Span B lines are the lines of the Ichimoku indicator, plotted to the 1H timeframe from the 4H one. They provide trading signals;
Extreme levels are thin red lines from which the price bounced earlier. They provide trading signals;
Yellow lines are trend lines, trend channels, and any other technical patterns;
Indicator 1 on the COT charts is the net position size for each category of traders;
Indicator 2 on the COT charts is the net position size for the Non-commercial group.
 English
 Русский
 Bahasa Indonesia
 Bahasa Malay
 ไทย
ไทย Español
 Deutsch
 Български
 Français
 Tiếng Việt
 中文
中文 বাংলা
বাংলা हिन्दी
 Čeština
 Українська
 Română

