Ethereum's Upward Journey Amidst Crypto ETF Buzz
Understanding the Current ETH/USD Dynamics
Key Takeaways:
- Ethereum (ETH) shows resilience with potential for upward movement.
- Bitcoin ETF developments in the US impact broader crypto markets.
- Technical indicators suggest mixed signals, requiring careful analysis.

Ethereum, a leading cryptocurrency, is exhibiting signs of an upward trend. This movement occurs alongside significant developments in the crypto industry, notably in the United States.
Crypto Industry News Impact
The recent rush of Bitcoin ETF approval applicants in the US, including prominent entities like Valkyrie, WisdomTree, and BlackRock, marks a pivotal moment. Such developments often ripple through the crypto market, influencing currencies like Ethereum.
Technical Analysis of ETH/USD
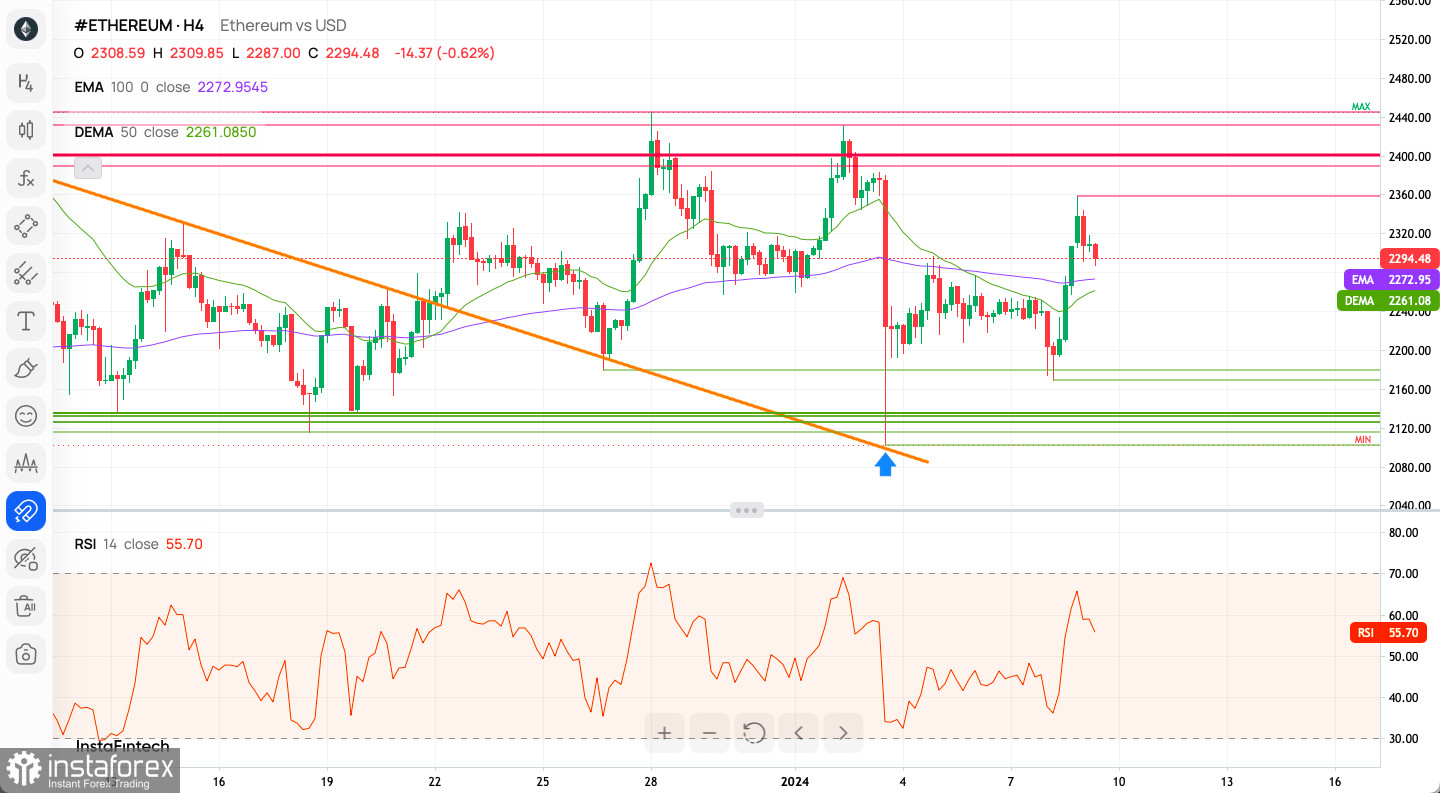
As of January 9, 2024, Ethereum (ETH) has shown an attempt to resume its uptrend. The ETH/USD pair reached a high of $2,358 but encountered resistance, leading to a minor pull-back. Key support levels are at $2,292 and $2,251, with resistance at $2,390 and beyond. The market's positive momentum supports a short-term bullish outlook for Ethereum. However, a break below $2,105 would shift the perspective to bearish.

Intraday Indicators:
- Sell signals: 13 out of 23 technical indicators.
- Buy signals: 3 out of 23 technical indicators.
- Neutral: 3 out of 23 technical indicators.
- Moving averages: 10 indicate Buy, 8 indicate Sell.
Market Sentiment and Pivot Points
The sentiment is predominantly bullish (79%). Pivot Points, crucial for trend reversals and support/resistance levels, are as follows:
- Weekly Highs: WR3 - $2,912, WR2 - $2,583, WR1 - $2,406.
- Weekly Pivot: $2,253.
- Weekly Lows: WS1 - $2,077, WS2 - $1,924, WS3 - $1,594.
Trading Outlook
The Ethereum market has seen an upward movement from the low of $1,520. As long as it stays above the crucial support at $1,368, the bullish outlook remains. The mid-term support at $1,913 is vital; a break below this would signal a bearish turn.
For Bulls: Maintaining above the key support levels and breaking past resistance points indicates a strong bullish market.
For Bears: A break below $2,105 and subsequent supports would confirm a bearish trend, offering opportunities for short positions.
Conclusion: Ethereum's current trajectory suggests potential for growth, influenced by broader market developments like the Bitcoin ETFs in the US. However, traders must consider mixed technical signals and maintain vigilance over key support and resistance levels for informed trading decisions.
Useful Links
Important Notice
The begginers in forex trading need to be very careful when making decisions about entering the market. Before the release of important reports, it is best to stay out of the market to avoid being caught in sharp market fluctuations due to increased volatility. If you decide to trade during the news release, then always place stop orders to minimize losses.
Without placing stop orders, you can very quickly lose your entire deposit, especially if you do not use money management and trade large volumes. For successful trading, you need to have a clear trading plan and stay focues and disciplined. Spontaneous trading decision based on the current market situation is an inherently losing strategy for a scalper or daytrader.
 English
 Русский
 Bahasa Indonesia
 Bahasa Malay
 ไทย
ไทย Español
 Deutsch
 Български
 Français
 Tiếng Việt
 中文
中文 বাংলা
বাংলা हिन्दी
 Čeština
 Українська
 Română

