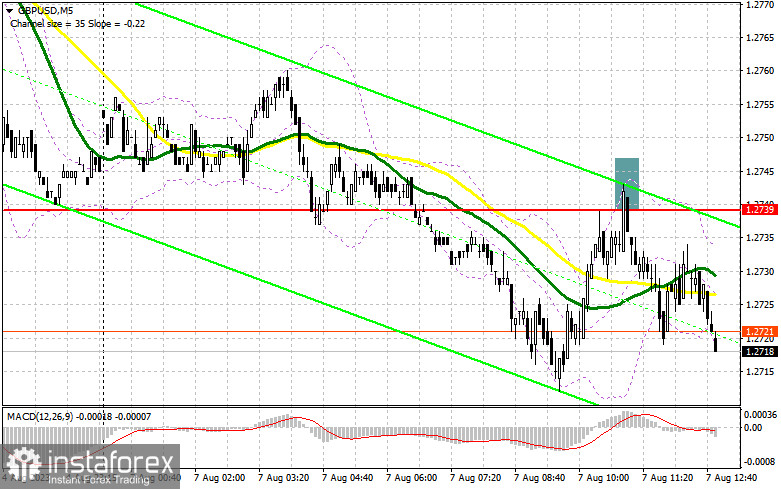
In my morning forecast, I drew attention to the 1.2739 level and suggested deciding to enter the market based on it. Examining the 5-minute chart, we see that a rise and the formation of a false breakout at this level generated a sell signal for the pair, resulting in a drop of over 20 points. Despite this, the technical outlook still needed to be revised for the second half of the day.

To open long positions on GBP/USD, consider the following:
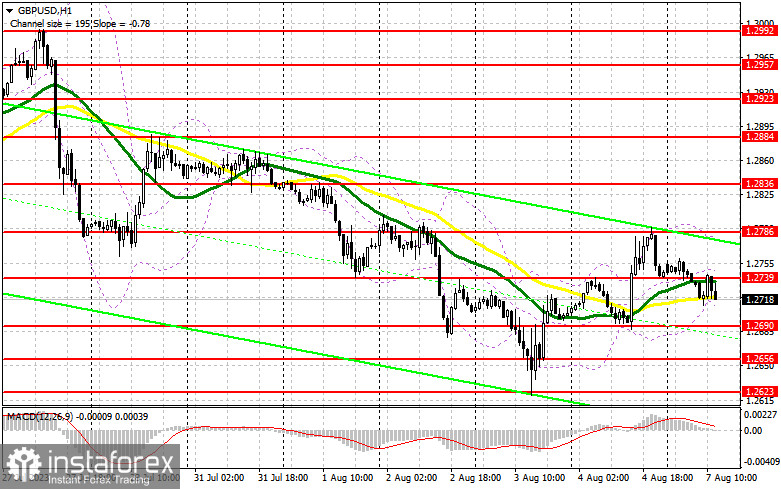
For now, sellers have the advantage, and buyers have slim chances of re-entering the market – especially in the lead-up to statements from the Federal Reserve representatives scheduled for the second half of the day. Remarks from FOMC member Patrick T. Harker are anticipated, along with hawkish comments from Michelle Bowman, who, over the weekend, advocated for further rate hikes. This situation is unfavorable for the British pound in the current conditions. If the pressure on the pound persists in the second half of the day, I'll act only after seeing a false breakout around the 1.2690 area. This would provide a good entry point for long positions, leading to another surge toward the resistance level of 1.2739. The moving averages at this range also favor the bears. A breakout and consolidation above this range offer a chance for a bullish market with a potential renewal of 1.2786. The ultimate target would be the resistance at 1.2836, where I would recommend taking profits. If there's a decline to 1.2690 without buyers in the second half of the day, the pressure on the pound will persist. In such a scenario, only the defense of the subsequent 1.2656 area and a false breakout would signal the opening of long positions. I plan to buy GBP/USD immediately on a rebound only from a minimum of 1.2623, with a correction target of 30-35 points within the day.
To open short positions on GBP/USD, consider the following:
If the trading continues below 1.2739, we can expect further pound depreciation. If there's an upward surge in GBP/USD following the statements of the Federal Reserve representatives, only another unsuccessful consolidation above this range, similar to what I analyzed earlier, will signal a sell with a return perspective to the minimum of 1.2690, from where the main rise of the pair was observed on Friday. A breakout and a reverse test from below this range will seriously damage buyers' positions, offering a chance for a more significant drop in GBP/USD to 1.2656. The ultimate target will be a minimum of 1.2623, where I will take profits. If GBP/USD grows and there's no activity at 1.2739 in the second half of the day, and since this level has already been tested once, the pair's situation will stabilize, and the bulls will retain a chance for an ascending correction to 1.2786. Only a false breakout at this level will offer an entry point for short positions. If there's no downward movement, I will sell the pound immediately on a rebound from 1.2836 but only anticipate a pair correction down by 30-35 points within the day.


Indicator signals:
Moving Averages:
Trading occurs around the 30 and 50-day moving averages, indicating a sideways market trend.
Note: The author considers the period and prices of the moving averages on the hourly chart H1 and differ from the general definition of classical daily moving averages on the daily chart D1.
Bollinger Bands:
In case of a decline, the lower border of the indicator at around 1.2710 will serve as support.
Description of indicators:
• Moving average (determines the current trend by smoothing out volatility and noise). Period 50. Marked in yellow on the chart.
• Moving average (determines the current trend by smoothing out volatility and noise). Period 30. Marked in green on the chart.
• MACD indicator (Moving Average Convergence/Divergence — convergence/divergence of moving averages). Fast EMA period 12. Slow EMA period 26. SMA period 9.
• Bollinger Bands. Period 20.
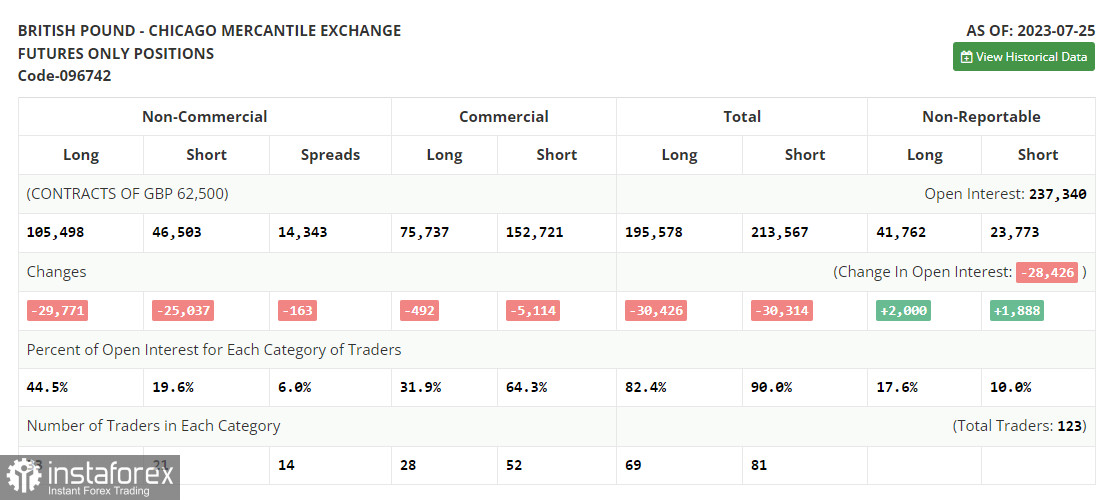
• Non-commercial traders - speculators, such as individual traders, hedge funds, and large institutions, use the futures market for speculative purposes and meet specific requirements.
• Long non-commercial positions represent the total long open positions of non-commercial traders.
• Short non-commercial positions represent the total short open positions of non-commercial traders.
• The total non-commercial net position is the difference between non-commercial traders' short and long positions.
 English
 Русский
 Bahasa Indonesia
 Bahasa Malay
 ไทย
ไทย Español
 Deutsch
 Български
 Français
 Tiếng Việt
 中文
中文 বাংলা
বাংলা हिन्दी
 Čeština
 Українська
 Română

