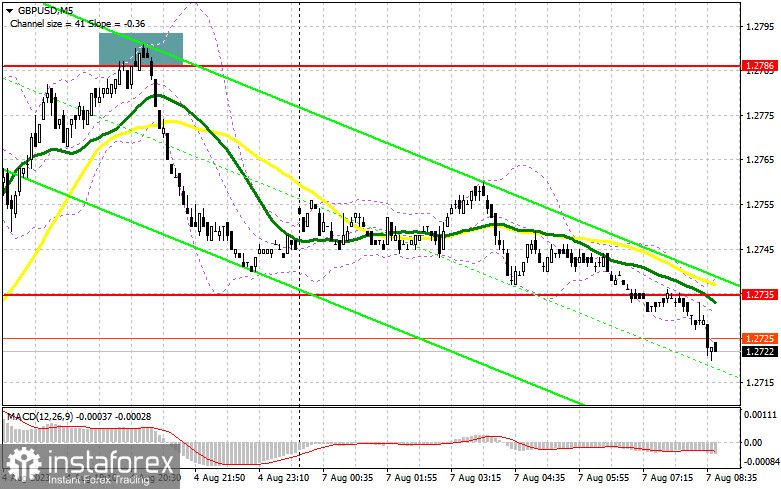
On Friday, the instrument formed quite a few good market entry signals. Now let's look at the 5-minute chart and try to figure out what actually happened. Previously, I considered entering the market from the level of 1.2735. Growth and false breakout on this mark produced a sell signal. As a result, the pair fell by over 30 pips. In the afternoon, after a sharp growth, a false breakout at 1.2786 gave another sell signal, which resulted in over a 40 pips decline.

For long positions on GBP/USD:
Weak US labor market data gave hope that the pound could rise further, but given the pressure we observed in today's Asian session, buyers could be dealing with a lot more problems than it seems. Today's UK house price index report from Halifax can increase the pressure on the pair.
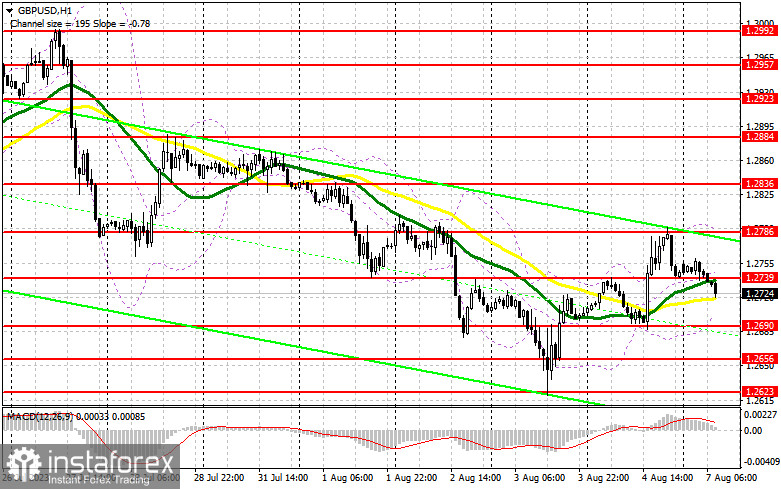
A false breakout near 1.2690 will produce a buy signal, which will lead to a breakthrough to the resistance area at 1.2739, which is in line with the bearish moving averages. A breakout and consolidation above this range is a chance to build a bull market and an update of 1.2786. The most distant target in this case will be resistance at 1.2836, where I will take profits.
If GBP/USD falls and there are no bulls at 1.2690, the pound will remain under pressure. In this case, only the protection of 1.2656, as well as a false breakout on this mark, will create new entry points into long positions. You could buy GBP/USD at a bounce from 1.2623, keeping in mind an upward intraday correction of 30-35 pips.
For short positions on GBP/USD:
The bears lost the battle on Friday, but quickly compensated part of the growth, keeping the pressure at today's Asian session. An unsuccessful consolidation above the new resistance at 1.2739 in the first half of the day will produce a sell signal with the prospect of returning to the 1.2690 low, from which the main growth of the pair was observed on Friday. A breakout and an upward retest of this range will deal a serious blow to the buyers' positions, potentially sending the pair down to 1.2656. A more distant target will be the low of 1.2623, where I will be taking profits. However, it is unlikely to be updated today.

If GBP/USD grows and there is no activity at 1.2739, the situation will become stable, and the bulls will get a chance to build a correction to the area of 1.2786. Only a false breakout at this level will give an entry point for short positions. If there is no downward movement there, I will sell the pound immediately on the rebound right from 1.2836, but only in the expectation of the pair's correction down by 30-35 pips intraday.
COT report:
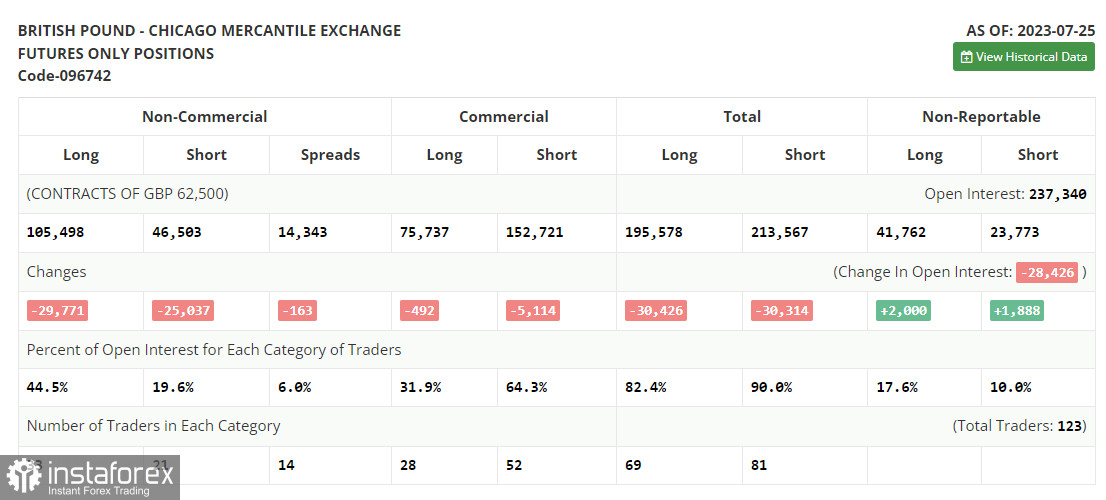
According to the COT report (Commitment of Traders) for July 25th, there was a decrease in both long and short positions. Traders were closing their positions ahead of the Federal Reserve meeting, as the outcome could have resulted in various scenarios. As a result, there were no significant changes in the market, as the central bank raised rates while leaving the possibility open for another aggressive move. However, take note that this report does not yet reflect the new positions of players who returned to the market after the central bank meeting. Most likely, strong data on the US economy shifted the balance towards sellers of the pound and buyers of the US dollar. Buying the pound on dips remains the optimal strategy, as the difference in central bank policies will impact the prospects of the US dollar. According to the latest COT report, non-commercial long positions decreased by 28,771 to 105,498, while non-commercial short positions fell by 25,037 to 46,503. As a result, the spread between long and short positions narrowed by only 163. The weekly price fell to 1.2837 from 1.3049.

Indicator signals:
Moving Averages
Trading is taking place around the 30-day and 50-day moving averages, indicating a sideways market trend.
Note: The period and prices of moving averages are considered by the author on the one-hour chart that differs from the general definition of the classic daily moving averages on the daily chart.
Bollinger Bands
If GBP/USD declines, the indicator's lower border near 1.2705 will serve as support.
Description of indicators:
• A moving average of a 50-day period determines the current trend by smoothing volatility and noise; marked in yellow on the chart;
• A moving average of a 30-day period determines the current trend by smoothing volatility and noise; marked in green on the chart;
• MACD Indicator (Moving Average Convergence/Divergence) Fast EMA with a 12-day period; Slow EMA with a 26-day period. SMA with a 9-day period;
• Bollinger Bands: 20-day period;
• Non-commercial traders are speculators such as individual traders, hedge funds, and large institutions who use the futures market for speculative purposes and meet certain requirements;
• Long non-commercial positions represent the total number of long positions opened by non-commercial traders;
• Short non-commercial positions represent the total number of short positions opened by non-commercial traders;
• The non-commercial net position is the difference between short and long positions of non-commercial traders.
 English
 Русский
 Bahasa Indonesia
 Bahasa Malay
 ไทย
ไทย Español
 Deutsch
 Български
 Français
 Tiếng Việt
 中文
中文 বাংলা
বাংলা हिन्दी
 Čeština
 Українська
 Română

