Today at 12:30 GMT, market participants are focused on the release of the latest monthly report from the U.S. Department of Labor with data for July. At the same time (at 12:30 GMT), Statistics Canada will present a report with data on the Canadian labor market for July.
In other words, at this time, we should expect a sharp increase in market volatility, primarily in quotes of the U.S. and Canadian dollars.
Now, let's consider the dynamics of the EUR/CAD cross-pair.

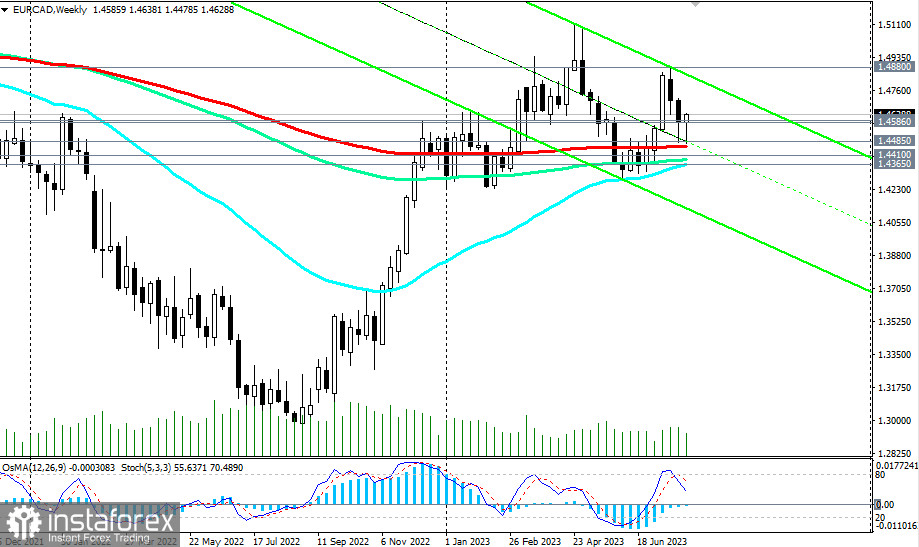
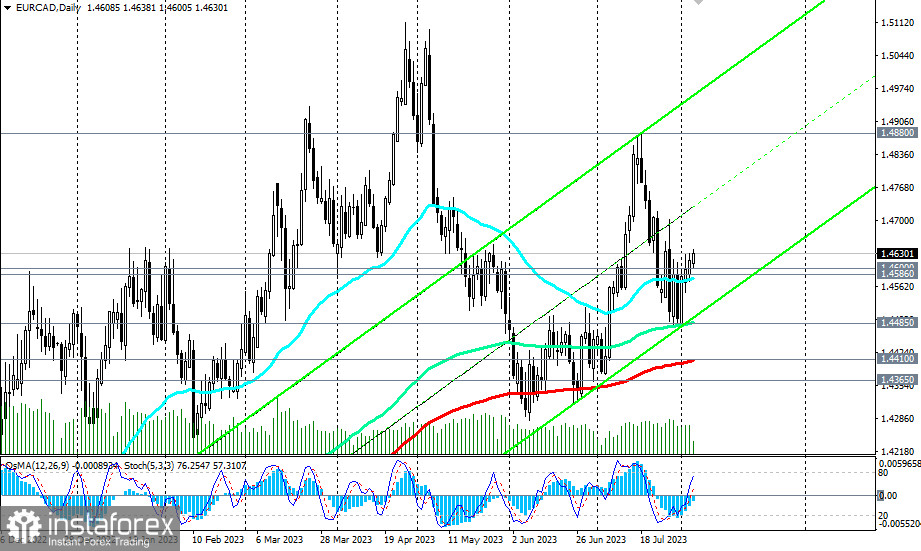
After breaking through key resistance levels of 1.4410 (200 EMA on the daily chart) and 1.4485 (200 EMA on the weekly chart) at the beginning of last month, the pair is trading in a long-term bullish market zone.
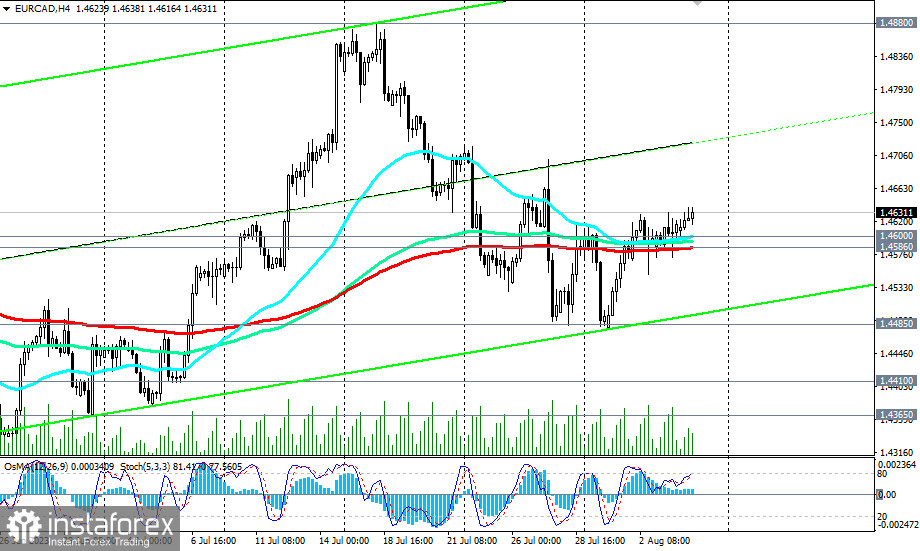
Technical indicators OsMA and Stochastic on the 1-hour, 4-hour, daily, and weekly charts are also in favor of buyers, confirming the preference for long positions.
If today's report from Statistics Canada turns out to be weak (an increase in unemployment in July by +0.1%, to 5.5% is expected) and disappoints market participants, we should expect further strengthening of the EUR/CAD pair.

In that case, long positions can be opened from the current levels at 1.4630 with targets at resistance levels of 1.4880 and 1.5090 (local highs). Further targets are located near resistance levels of 1.5900 and 1.5970.
In the alternative scenario, EUR/CAD will break through support levels of 1.4600 (200 EMA on the 1-hour chart), 1.4586 (200 EMA on the 4-hour chart), and after breaking through key support levels of 1.4410 and 1.4365, it will move deeper into the downward channel on the weekly chart, towards its lower boundary and the level of 1.4100.
The ultimate downside target is located near 1.2900 and 1.2860 (August 2022 lows).
In other words, EUR/CAD provides plenty of trading opportunities both to the upside and the downside.
Support levels: 1.4600, 1.4586, 1.4485, 1.4410, 1.4365
Resistance levels: 1.4700, 1.4800, 1.4830, 1.4900, 1.5000
 English
 Русский
 Bahasa Indonesia
 Bahasa Malay
 ไทย
ไทย Español
 Deutsch
 Български
 Français
 Tiếng Việt
 中文
中文 বাংলা
বাংলা हिन्दी
 Čeština
 Українська
 Română

