Bitcoin

Higher timeframes
Having achieved the daily target by breaking through the Ichimoku cloud at the first target level (31,387) and testing the zone of influence of the upper boundary of the weekly cloud (31,839), Bitcoin has started a corrective decline. At the moment, it has returned to the daily cloud, changing the direction of the daily Ichimoku cross. The next and most significant support zone in this market segment is currently the range of 28,134 - 28,272 (lower boundary of the daily cloud + weekly short-term trend). A break will form new targets and open up new prospects. If the current bearish activity is completed and buyers return to the market, the nearest targets will be the resistance levels of the daily death cross of Ichimoku (29,380 - 29,918 - 30,276 - 30,633). Then, all attention will be focused again on breaking out of the weekly cloud (31,839) into the bullish zone.

H4 - H1
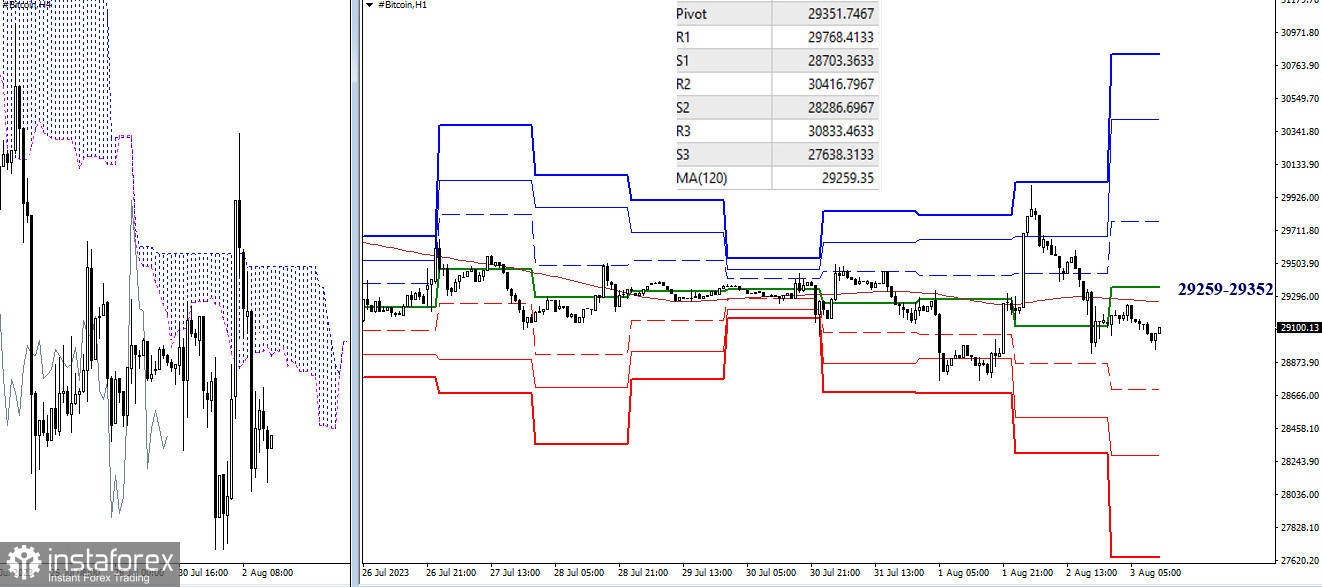
The lack of significant results on higher timeframes has led to some sideways movement on lower timeframes. Bitcoin is showing mixed success in staying above or below the weekly long-term trend, which has been in a horizontal position for quite some time, indicating some market uncertainty. Today, the trend is located at 29,259. Anything above this will be relevant in case of stronger bullish sentiment, and these levels are 29,352 - 29,768 - 30,417 - 30,833 (resistance levels of classic pivot points). Anything below 29,259 will be worked on and have significance in case of further decline and bearish activity. The support levels of classic pivot points at the moment are at 28,703 - 28,287 - 27,638.
***
The technical analysis of the situation uses:
Higher timeframes - Ichimoku Kinko Hyo (9.26.52) + Fibo Kijun levels
H1 - Pivot Points (classic) + Moving Average 120 (weekly long-term trend)
 English
 Русский
 Bahasa Indonesia
 Bahasa Malay
 ไทย
ไทย Español
 Deutsch
 Български
 Français
 Tiếng Việt
 中文
中文 বাংলা
বাংলা हिन्दी
 Čeština
 Українська
 Română

