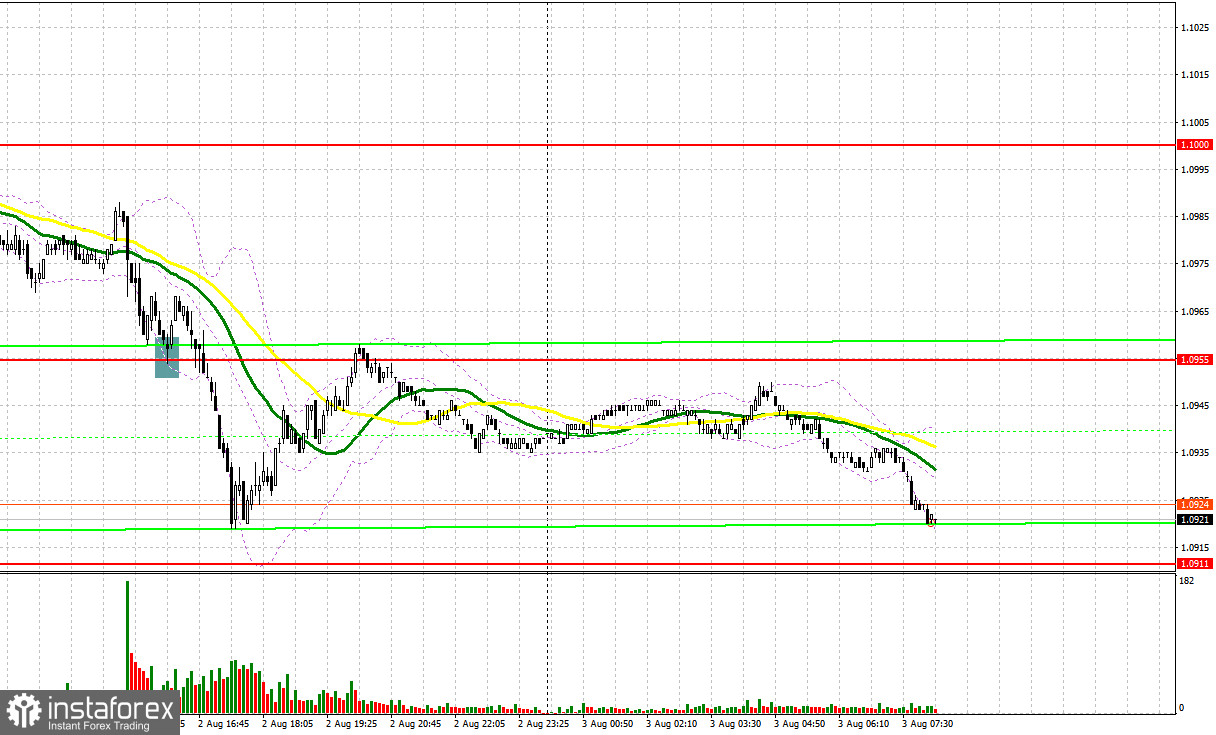
Yesterday, there was only one trading signal. Let's look at the 5M chart and figure out what actually happened. In my morning article, I turned your attention to 1.1000 and recommended making decisions with this level in focus. There was no rise as well as a false breakout of 1.1000 due to low volatility against the backdrop of the absence of important reports. In the afternoon, a false breakout of 1.0955 gave a buy signal but the euro grew by only 10 pips. After that, the pressure on the pair returned.
 When to open long positions on EURUSD:
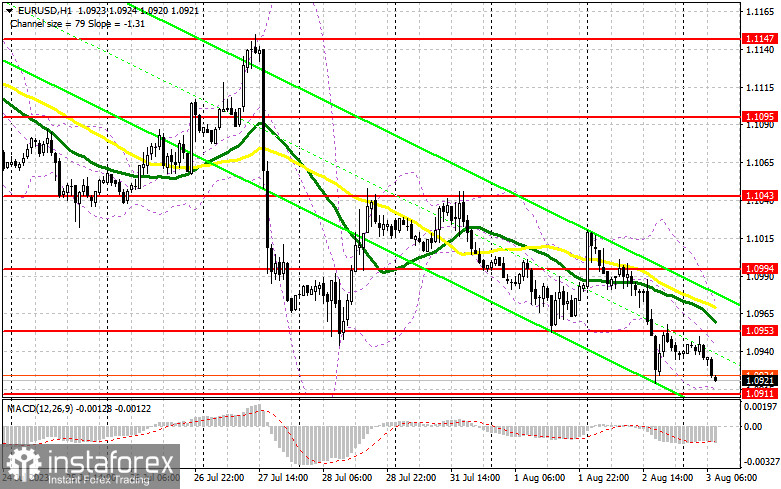
EUR bulls gave up after the release of strong ADP data for July. The euro/dollar pair is likely to decline lower today as the EU Manufacturing, Services, and Composite PMI Indices are on tap. A contraction in indicators will certainly increase the pressure on the pair, which has been struggling to grow after the bulls failed to defend 1.1000. For this reason, I would advise you not to rush to open long positions. It would be appropriate to trade against the bearish trend only after the drop from the support level of 1.0911. Only after the formation of a false breakout, it will be possible to get a buy signal based on an upward movement. The pair is likely to hit the resistance level of 1.0953. A breakout and a downward retest of this range amid strong PMI indices will boost demand for the euro. It may return to a high of 1.0994. The pair will hardly be able to climb higher. A more distant target will be the 1.1043 level where I recommend locking in profits. If EUR/USD falls and bulls fail to protect 1.0911, which is quite likely in the afternoon after the ISM reports, bulls could lose control. In this case, only a false breakout of the support level of 1.0871 will provide new entry points into long positions. You could buy EUR/USD immediately at a bounce from the low of 1.0836, keeping in mind an upward intraday correction of 30-35 pips.
When to open short positions on EURUSD:
Sellers still have a chance of maintaining a bear market as long as trading is conducted below the 1.0953 level. This level is very important. If they fail to defend it, the bulls will regain ground at the end of the week and will try to push the pair in the sideways channel. In case of a rise in EUR/USD, I plan to open short positions only after a false breakout of 1.0953 where the moving averages are passing in negative territory. All this could lead to a fall to the support level of 1.0911, which the pair made an attempt to approach yesterday. Only after a breakout and consolidation below this level as well as an upward retest due to weak EU reports, there might be a sell signal. The pair is likely to dip to 1.0871. This will indicate the formation of a bearish trend. A more distant target will be the 1.0836 level where I recommend locking in profits. If EUR/USD rises during the European session and bears show no energy at 1.0953, the bulls will try to regain control. In this case, I would advise you to postpone short positions until a breakout of 1.0994. You could sell EUR/USD immediately at a bounce from 1.1043, keeping in mind a downward intraday correction of 30-35 pips.
COT report:
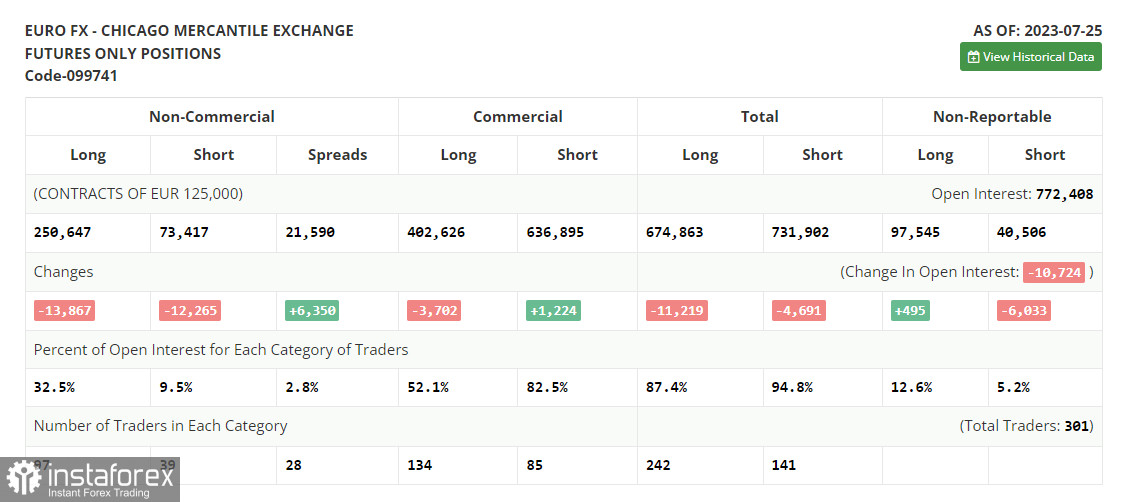
According to the COT report (Commitment of Traders) for July 25, there was a sharp decline in both long and short positions before the meetings of the Federal Reserve System and the European Central Bank. However, the last report was published after the rate decisions. So, it does not reflect the real situation. The rate decisions were in line with the expectations. As a result, there was no surge in volatility. However, the situation changed after the release of US macro stats, indicating the resilience of the American economy in the 2nd quarter. Despite the downward correction, in the medium term, it is better to go long on the decline. The COT report showed that long non-profit positions decreased by 13,867 to 250,647, while short non-profit positions fell by 12,265 to 73,417. As a result, the spread between long and short positions increased by 6,350, which is rather favorable for the bulls. The closing price dropped to 1.1075 against 1.1300 a week earlier.  Indicator signals:
Moving averages:
Trading is carried out below the 30-day and 50-day moving averages, which indicates a further downward movement.
Note: The author considers the period and prices of moving averages on the H1 (1-hour) chart that differ from the general definition of the classic daily moving averages on the daily D1 chart.
Bollinger Bands
If EUR/USD declines, the indicator's lower border at 1.0911 will serve as support.
Indicator description:
- Moving average (MA) determines the current trend by smoothing volatility and noise. Period 50. Colored yellow on the chart.
- Moving average (MA) determines the current trend by smoothing volatility and noise. Period 30. Colored green on the chart.
- Moving Average Convergence/Divergence (MACD). Fast EMA 12. Slow EMA 26. SMA 9.
- Bollinger Bands. Period 20
- Non-commercial traders are speculators such as individual traders, hedge funds, and large institutions who use the futures market for speculative purposes and meet certain requirements.
- Long non-commercial positions are the total long position of non-commercial traders.
- Non-commercial short positions are the total short position of non-commercial traders.
- Total non-commercial net position is the difference between the short and long positions of non-commercial traders.
 English
 Русский
 Bahasa Indonesia
 Bahasa Malay
 ไทย
ไทย Español
 Deutsch
 Български
 Français
 Tiếng Việt
 中文
中文 বাংলা
বাংলা हिन्दी
 Čeština
 Українська
 Română

