Bank of Canada forecasts that "in the next year, inflation will be around 3%, and then gradually decrease to 2% by mid-2025." Most market participants believe that the Canadian central bank will maintain the interest rate at this level or slightly higher until the end of this year and may only start cutting it next year. This means that, in the medium term, the Canadian dollar will receive support from the Bank of Canada if it does not unexpectedly reverse its credit and monetary policy towards easing.
On Friday at 12:30 (GMT), a new surge in volatility in the Canadian dollar and USD/CAD pair is expected: at this time, Statistics Canada and the U.S. Bureau of Labor Statistics will release their monthly reports on the state of national labor markets.
Looking slightly ahead, it is worth noting that, in July, the unemployment rate in Canada is expected to rise by +0.1% to 5.5%, while in the U.S., it will remain at the previous multi-year low of 3.6%. Economists and market participants will also pay attention to other parameters of the data reports.

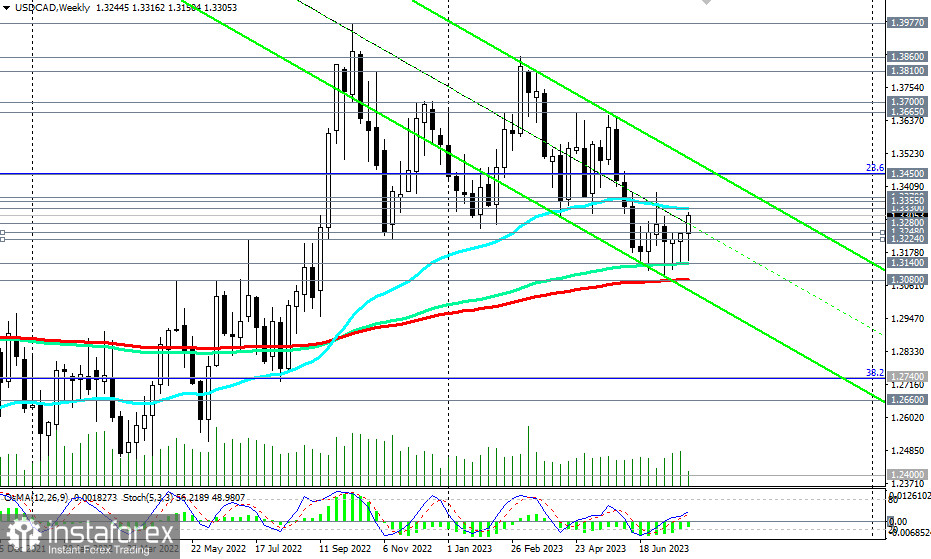
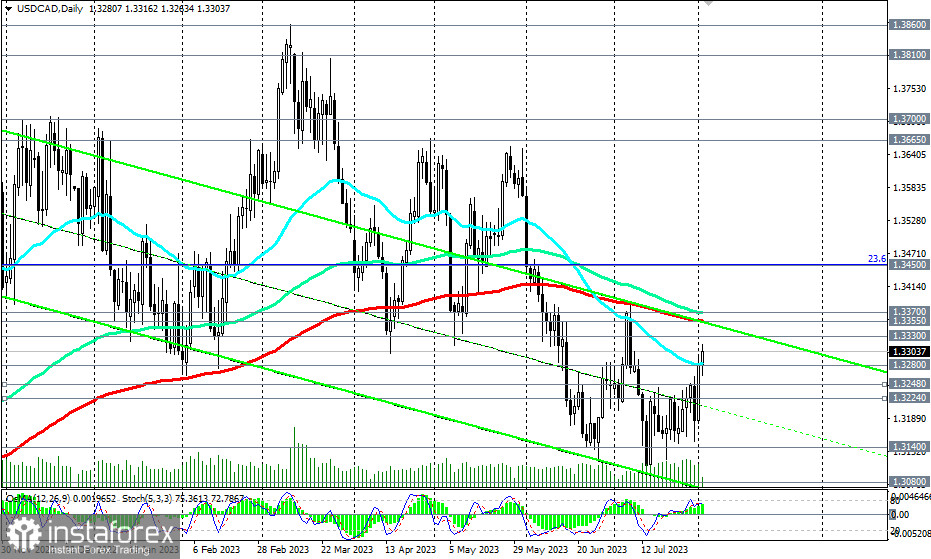
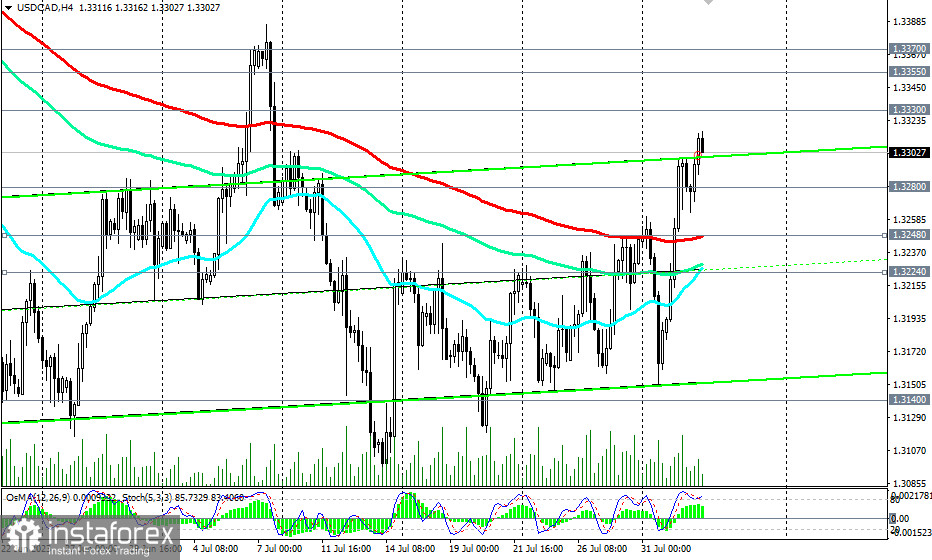
As of writing, the USD/CAD pair was trading near the 1.3300 level, correcting towards the key resistance zone and levels at 1.3355 (200 EMA on the daily chart), 1.3370 (144 EMA on the daily chart), separating the medium-term bearish market from the bullish one. Their breakout would also mean a return to the long-term bullish market zone, located above the key support levels at 1.3140 (144 EMA on the weekly chart), 1.3100, 1.3080 (200 EMA on the weekly chart).
However, for starters, the price needs to break the important resistance level at 1.3330 (50 EMA on the weekly chart) to confirm the serious intentions of USD/CAD buyers.

In an alternative scenario, USD/CAD will resume its decline. The first signal for selling is the breakdown of the local support level and 50 EMA on the daily chart, passing through the 1.3280 level, and the confirming signal is the break below the important short-term support level at 1.3248 (200 EMA on the 4-hour chart).
The breakdown of the key support levels at 1.3140 (144 EMA on the weekly chart), 1.3100, 1.3080 (200 EMA on the weekly chart) will return USD/CAD to the long-term bearish market zone, making short positions preferable.
Support levels: 1.3300, 1.3280, 1.3264, 1.3248, 1.3224, 1.3200, 1.3140, 1.3100, 1.3080
Resistance levels: 1.3330, 1.3355, 1.3370, 1.3400, 1.3450, 1.3600, 1.3665, 1.3700, 1.3810, 1.3860, 1.3900, 1.3970, 1.4000
 English
 Русский
 Bahasa Indonesia
 Bahasa Malay
 ไทย
ไทย Español
 Deutsch
 Български
 Français
 Tiếng Việt
 中文
中文 বাংলা
বাংলা हिन्दी
 Čeština
 Українська
 Română

