The Prospect af a Bitcoin ETF: A Game Changer?
Key Takeaways
- Spot Bitcoin ETF: Its approval could significantly impact Bitcoin's value, attracting institutional investment.
- Expert Predictions: Both Mow and Pal foresee a substantial rise in Bitcoin's price, driven by macroeconomic factors and institutional involvement.
- Technical Analysis: Current indicators support a bullish outlook, but caution is advised due to the overbought market condition.
The Impact of Institutional Capital
The cryptocurrency community is abuzz with the potential approval of a spot Bitcoin ETF. This development could bring substantial institutional capital into Bitcoin. Experts like Samson Mow and Raoul Pal predict a significant price surge, potentially reaching $1 million.

Analytics Perspective on Bitcoin's Growth
Samson Mow, CEO of JAN3, believes the current bull market breaks the traditional four-year cycle. He anticipates a drastic price increase due to a unique combination of supply, demand, and price shocks. Mow states:
"It looks like all spot Bitcoin ETFs will be approved on the same day.... This will hit the very limited supply of Bitcoin on exchanges and availability for purchase with a torrent of money. So it's basically a supply shock multiplied by a demand shock. And this causes a price shock."
Mow emphasizes the transformative effect of US institutional capital flowing into Bitcoin.
How About Macroeconomic View
Raoul Pal, CEO of Real Vision, sees Bitcoin reaching between $500,000 and $1 million by 2025. He cites two major trends – the business cycle and financial conditions – as significant influencers. Pal notes:
"These cycles can be crazy, and this one is more like the 2017 cycle than the previous one. In that cycle, central banks did not print much [...]. Central bank balance sheets are [currently] growing. We saw an increase of 20%. However, what happened with liquidity was an absolute explosion of cryptocurrencies."
BTC/USD Technical Outlook
Recent Price Movements
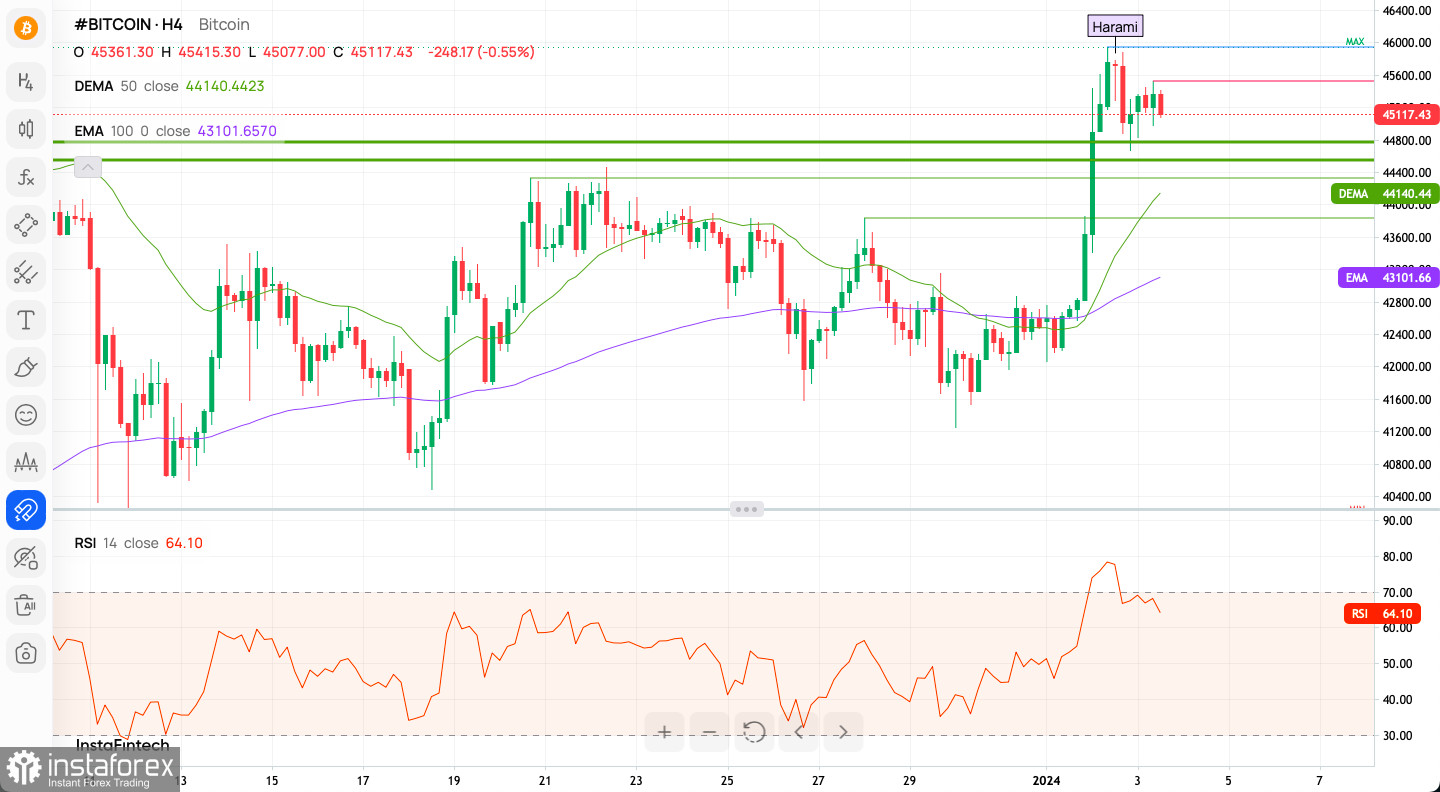
The BTC/USD pair had tested the 2023 high and the technical support located at the level of $44,784 and is consolidating the recent gains around the level of $45,500. The level of $44,784 and $44,572 will act as the intraday technical support as well. The intraday technical resistance is located at $45,519. The bulls are in charge of the market as the momenum remains strong and positive, however the market conditions are now extremely overbought, so a pull-back lower to cool off the market participants is welcome.

Intraday Indicators
- Most technical indicators and moving averages signal a Buy, reinforcing the bullish trend.
- The sentiment remains strongly bullish, both in recent days and over the past week.
Weekly Pivot Points and Weekly Time Frame Outlook
Pivot Points Analysis Pivot points indicate key levels for potential trend reversals or continuation. The current positioning of Bitcoin suggests it is in a phase of consolidation with a bullish undertone.
WR3 - $51,335
WR2 - $48,021
WR1 - $46,896
Weekly Pivot - $44,707
WS1 - $43,582
WS2 - $41,393
WS3 - $38,079
Weekly Trading Outlook
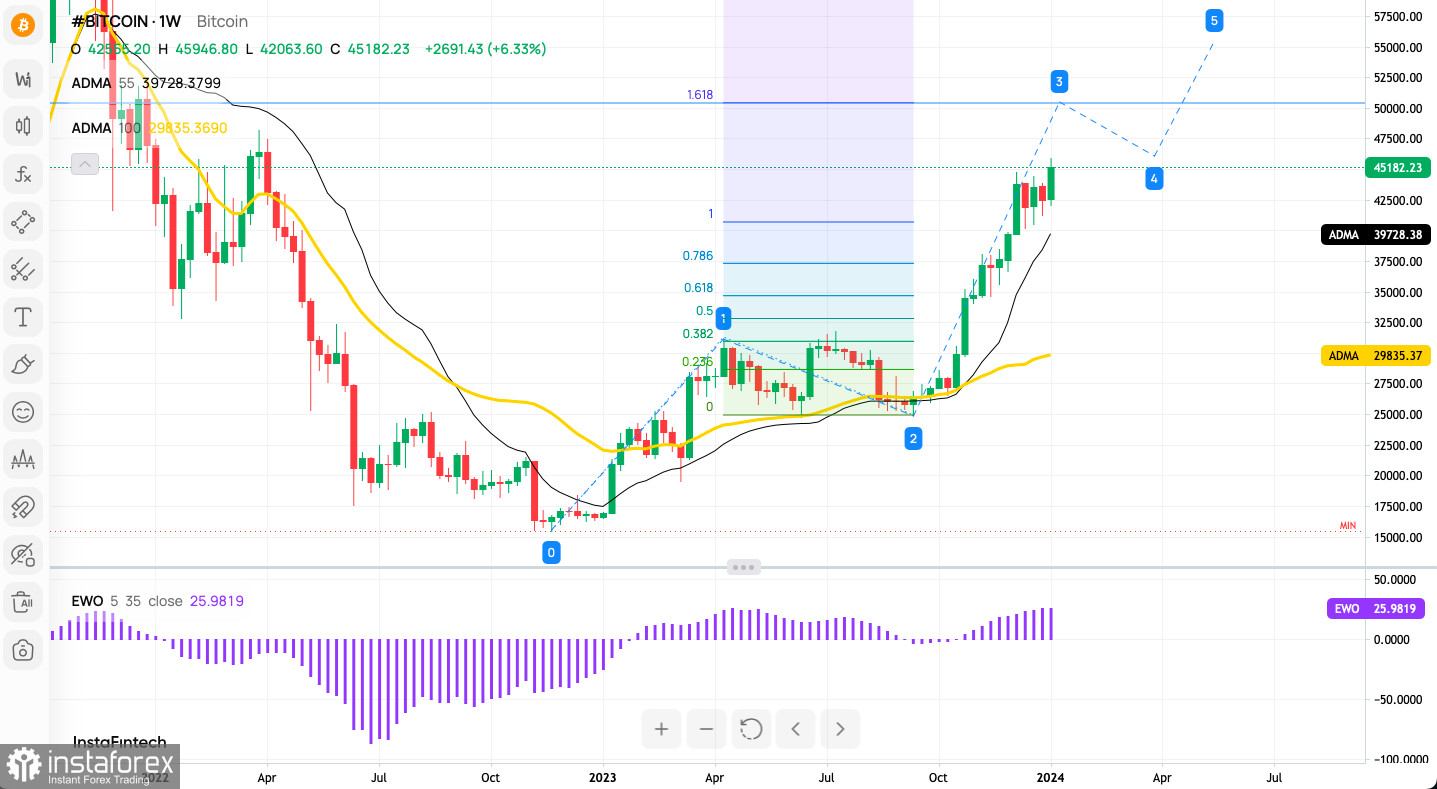
Moving Averages: The chart displays two Adaptive Moving Averages (ADMA), with periods of 55 and 100 weeks. The price of Bitcoin is above both, indicating a strong bullish trend over the medium to long term.
Elliott Wave Theory: The chart suggests an Elliott Wave pattern is forming, with the current price movement potentially being in the wave 3, which is typically the longest and strongest wave. If the pattern holds true, this could imply continued bullish momentum in the coming weeks.
Fibonacci Levels: A Fibonacci Projection tool is applied to weekly chart, with Bitcoin's price action respecting the Fibonacci levels well. According to the Fibonacci tool, the next projected target for wave 3 is seen at $50,450.
EWO Oscillator: The Elliott Wave Oscillator (EWO) is also featured, currently showing positive momentum, which aligns with the bullish sentiment indicated by the price being above the moving averages and the progression of the Elliott Wave pattern.
Conclusion: The overall analysis of this Bitcoin chart indicates a bullish trend with potential for continued upward movement. The next long term technical target for the bulls is set at $48,200 as the potential for a sustained long-term uptrend remains, provided the critical level of $19,572 is not decisively violated. The key long-term technical support is located at the level of $32,829 and $31,790.

Conclusion: Trading Insights for BTC/USD
For Bullish Traders: The current market conditions favor bullish positions. Keep an eye on pivot points and resistance levels for potential breakout opportunities.
For Bearish Traders: A cautious approach is advised. Watch for a potential pullback as an entry point, but be mindful of the strong bullish sentiment.
Useful Links
Important Notice
The begginers in forex trading need to be very careful when making decisions about entering the market. Before the release of important reports, it is best to stay out of the market to avoid being caught in sharp market fluctuations due to increased volatility. If you decide to trade during the news release, then always place stop orders to minimize losses.
Without placing stop orders, you can very quickly lose your entire deposit, especially if you do not use money management and trade large volumes. For successful trading, you need to have a clear trading plan and stay focues and disciplined. Spontaneous trading decision based on the current market situation is an inherently losing strategy for a scalper or daytrader.
 English
 Русский
 Bahasa Indonesia
 Bahasa Malay
 ไทย
ไทย Español
 Deutsch
 Български
 Français
 Tiếng Việt
 中文
中文 বাংলা
বাংলা हिन्दी
 Čeština
 Українська
 Română

