Understanding the Current Momentum on GBP/USD pair
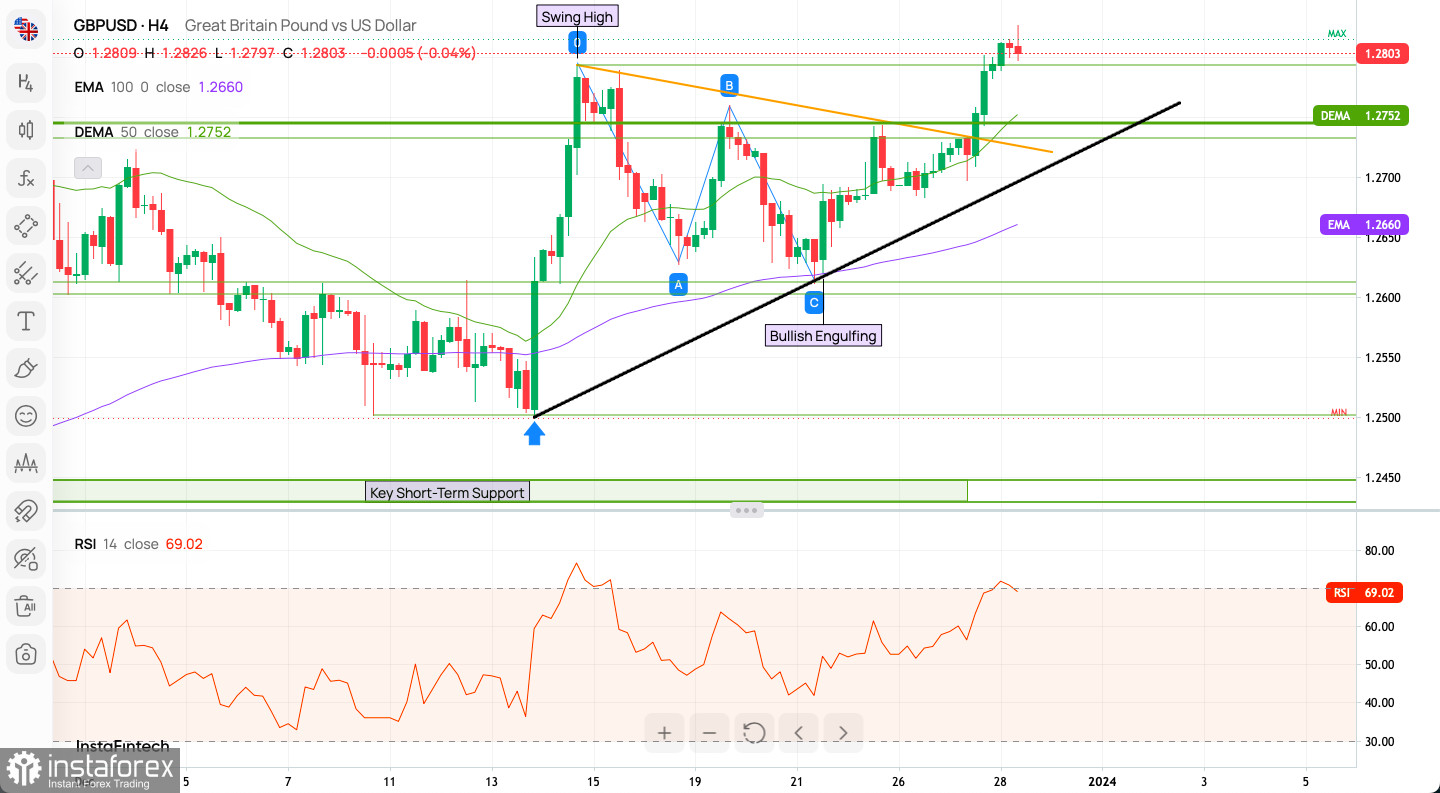
The GBP/USD currency pair, also known as "Cable," recently achieved a notable milestone. It surpassed a significant resistance level at 1.2782, reaching a new high at 1.2826. This breakthrough is crucial for traders as it transforms the previous resistance into a support zone, now at 1.2782, followed by 1.2745 and 1.2732. The bullish momentum is targeting the July 2023 high of 1.2994.

Trend Analysis
- The H4 chart displays a clear uptrend, as indicated by the ascending black trend line marked with points A and B. This line acts as dynamic support for the price movement.
- The presence of a Bullish Engulfing pattern near the trend line suggests a strong buying pressure and a potential continuation of the uptrend.
- The swing high marked on the chart represents a recent peak which could be a point of support.
Moving Averages
- The EMA 100 (Exponential Moving Average) line in green is below the current price, suggesting the short-term trend is bullish.
- The DEMA 50 (Double Exponential Moving Average) in purple is also below the current price, further confirming the bullish trend.
Support and Resistance
- The green horizontal line marked as "Key Short-Term Support" suggests a significant level where the price previously found support.
- The "MIN" and "MAX" labels likely indicate the range of price movement for the analyzed period.
Momentum Indicator
- The RSI (Relative Strength Index) is at 69.02, which is just below the overbought threshold of 70. This implies that the market is becoming quite bullish, but there is a risk of a pullback if it crosses into overbought territory.
Intraday Indicator Signals
- Buy Signals: 12 out of 21 technical indicators
- Neutral Signals: 6 indicators
- Sell Signals: 3 indicators
- Moving Averages: 18 out of 18 indicate Buy
Market Sentiment Analysis
The sentiment scoreboard shows a predominantly bullish outlook, with 56% bulls versus 44% bears. This bullish trend has been consistent over the past week and recent days.
Key Weekly Pivot Levels:
- WR3: 1.28261
- WR2: 1.27709
- WR1: 1.27522
- Pivot: 1.27157
- WS1: 1.26970
- WS2: 1.26605
- WS3: 1.26053
These pivot points serve as critical markers for intraday traders, indicating potential support and resistance levels.

Longer-Term Trading Outlook:
On a weekly scale, the GBP/USD chart displays a Bullish Engulfing pattern, which emerged after breaking the 1.2340 barrier. This pattern signifies a strong bullish sentiment. The market is currently above both the 50 and 100 WMA, pointing towards the 2023 high at 1.3141 as the next bull target. However, if the pair falls below 1.1802, a significant support level, it could trigger a notable bearish movement, possibly reaching 1.1494.
Trading Scenarios for Bulls and Bears:
For bullish traders, the continuous holding of levels above 1.2782 and the targeting of the 1.2994 and 1.3141 levels offer optimistic scenarios. However, they should be alert for signs of a pullback due to the overbought conditions.
Bearish traders should watch for a break below 1.2782, which could signal a shift in sentiment. A sustained drop below this level could open a path towards 1.2745 and 1.2732, and in a more significant bear scenario, towards the 1.1802 level.
Useful Links:
Important Reminder:
The begginers in forex trading need to be very careful when making decisions about entering the market. Before the release of important reports, it is best to stay out of the market to avoid being caught in sharp market fluctuations due to increased volatility. If you decide to trade during the news release, then always place stop orders to minimize losses.
Without placing stop orders, you can very quickly lose your entire deposit, especially if you do not use money management and trade large volumes. For successful trading, you need to have a clear trading plan and stay focues and disciplined. Spontaneous trading decision based on the current market situation is an inherently losing strategy for a scalper or daytrader.
 English
 Русский
 Bahasa Indonesia
 Bahasa Malay
 ไทย
ไทย Español
 Deutsch
 Български
 Français
 Tiếng Việt
 中文
中文 বাংলা
বাংলা हिन्दी
 Čeština
 Українська
 Română

