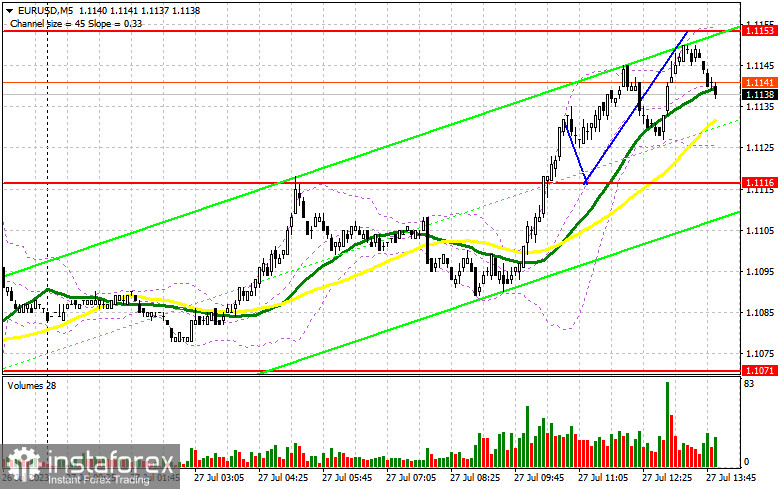
In my morning forecast, I highlighted the level of 1.1116 and recommended using it to make entry decisions in the market. Let's look at the 5-minute chart and analyze what happened there. The breakthrough of 1.1116 occurred, but I didn't see a reverse test from top to bottom, so I had to miss the upward movement of the pair. The technical picture remained unchanged for the second half of the day.

For opening long positions on EUR/USD, the following is required:
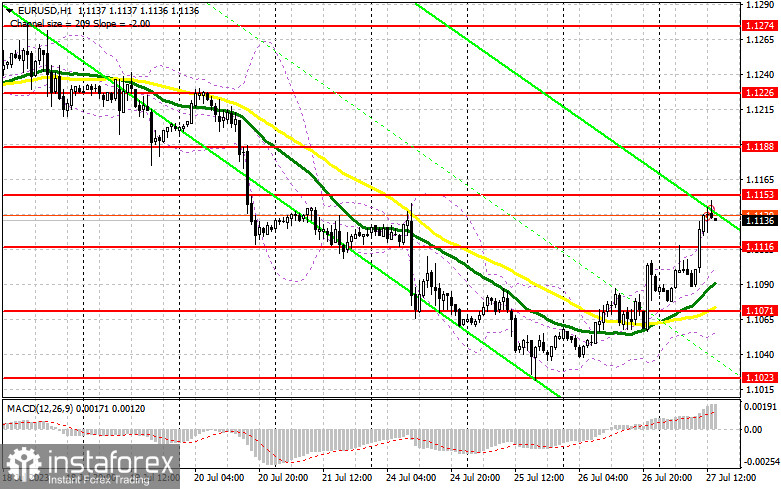
Considering that the European Central Bank's interest rate decision lies ahead, there is no point in revising support and resistance levels. I will act based on the scenarios I described in the morning forecast. In addition to the ECB decision, which is unlikely to cause significant market changes, we are awaiting data on changes in GDP for the second quarter of this year and the number of initial jobless claims in the US. The pace of the American economy's growth is of much greater interest than the expected ECB rate hike. If the reports disappoint, the euro will likely continue to rise against the dollar. If the bulls fail to show strength after the ECB decision, and if the US GDP surprises, pressure on the pair will return.
In this case, I will act only around the support level of 1.1116, which earlier played the role of resistance. A decline and the formation of a false breakout at this level will signal a buying opportunity with the target of further EUR/USD growth to 1.1153. A breakout and top-down test of this range will strengthen demand for the euro, giving it a chance to return to the peak at 1.1188. The ultimate target remains in 1.1226, where I will take profits. In the case of a decline in EUR/USD and no activity around 1.1116 in the second half of the day, the bulls will lose all initiative. Therefore, only a false breakout formation around the next support level of 1.1071, where the moving averages, which favor the bulls, are located, will signal a buying opportunity for the euro. I will consider opening long positions from the minimum of 1.1023 with the goal of an upward correction of 30-35 points within the day.
For opening short positions on EUR/USD, the following is required:
Sellers have taken a wait-and-see position. In case of weak US reports, the euro may continue to rise, allowing it to reach the resistance at 1.1153. I also expect a test of this level after the interest rate decision publication. I will act only after a false breakout, signaling a selling opportunity with a prospect of EUR/USD decline to the support at 1.1116. I anticipate the appearance of more significant buyers at this level, so I'm betting on a breakout and consolidation below this range only after Christine Lagarde's press conference, assuming she doesn't say anything new or provide any guidance for the future. A bottom-up test of 1.1116 will signal a sell opportunity, directly leading to 1.1071. The ultimate target will be in the area of 1.1023, where I will take profits.
In case of upward movement of EUR/USD during the American session and the absence of bears at 1.1153, which is also possible, given that the ECB may continue its firm policy, the bulls will maintain their advantage. In such a scenario, I will postpone short positions until the next resistance at 1.1188. There, selling is also possible, but only after an unsuccessful consolidation. I will consider opening short positions from the peak of 1.1226 with the target of a downward correction of 30-35 points.

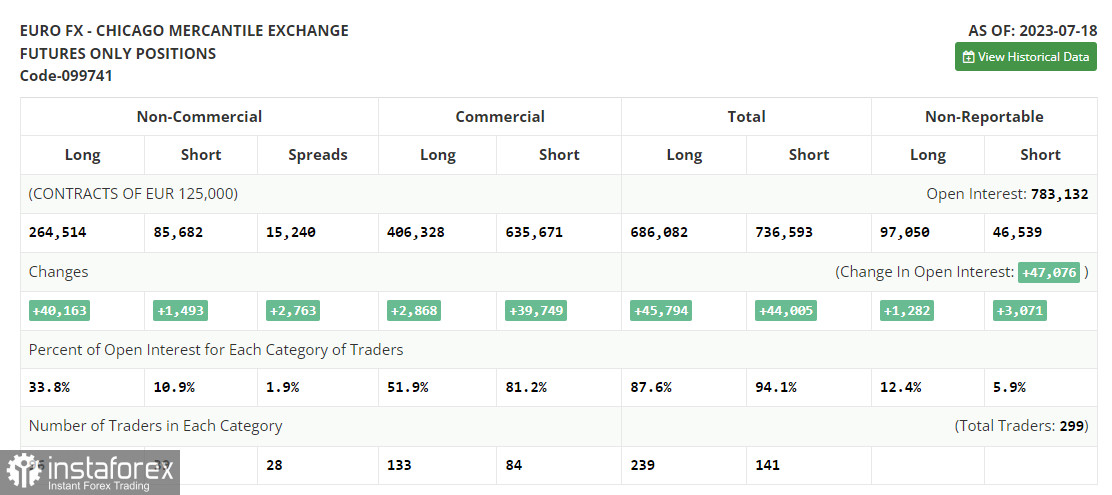
In the COT (Commitment of Traders) report for July 18th, both long and short positions increased. However, there were significantly more buyers, which strengthened their market position. The released inflation data in the US triggered purchases of risk assets, including the euro. Additionally, last week's statements by ECB representatives that it might be time to ease the firm policy in the eurozone further fueled expectations and bets on further euro growth against the dollar. This week, the Federal Reserve meeting will take place, where decisions on monetary policy will be made. Many economists expect it to be the last rate hike in the regulator's nearly one-and-a-half-year cycle of rate increases. This will further weaken the dollar. The ECB meeting is likely to have a hawkish character. For this reason, while the market is bullish, the optimal medium-term strategy remains to buy the euro on declines. The COT report indicates that long non-commercial positions increased by 40,163 to 264,514. In contrast, short non-commercial positions rose only by 1,493 to 85,682. The overall non-commercial net position increased to 178,000 compared to 140,162. The weekly closing price rose to 1.1300 from 1.1037.

Indicator signals:
Moving Averages
Trading is taking place above the 30 and 50-day moving averages, indicating an attempt by buyers to return to the market.
Note: The author considers the period and prices of the moving averages on the hourly chart (H1), which differs from the general definition of classical daily moving averages on the daily chart (D1).
Bollinger Bands
In the case of an uptrend, the upper boundary of the indicator around 1.1140 will act as resistance.
Description of Indicators:
• Moving Average: Determines the current trend by smoothing volatility and noise. Period 50. Marked in yellow on the chart.
• Moving Average: Determines the current trend by smoothing volatility and noise. Period 30. Marked in green on the chart.
• MACD Indicator (Moving Average Convergence/Divergence): Fast EMA period 12, Slow EMA period 26, SMA period 9.
• Bollinger Bands: Period 20.
• Non-commercial traders - speculators, such as individual traders, hedge funds, and large institutions, using the futures market for speculative purposes and subject to specific requirements.
• Long non-commercial positions represent the total long open positions of non-commercial traders.
• Short non-commercial positions represent the total short open positions of non-commercial traders.
• The overall non-commercial net position is the difference between non-commercial traders' short and long positions.
 English
 Русский
 Bahasa Indonesia
 Bahasa Malay
 ไทย
ไทย Español
 Deutsch
 Български
 Français
 Tiếng Việt
 中文
中文 বাংলা
বাংলা हिन्दी
 Čeština
 Українська
 Română

