 English
  Русский
 Bahasa Indonesia
 Bahasa Malay
 ไทย
ไทย Español
 Deutsch
 Български
 Français
 Tiếng Việt
 中文
中文 বাংলা
বাংলা हिन्दी
 Čeština
 Українська
 Română

Analyzing Wednesday's trades:
EUR/USD on 30M chart
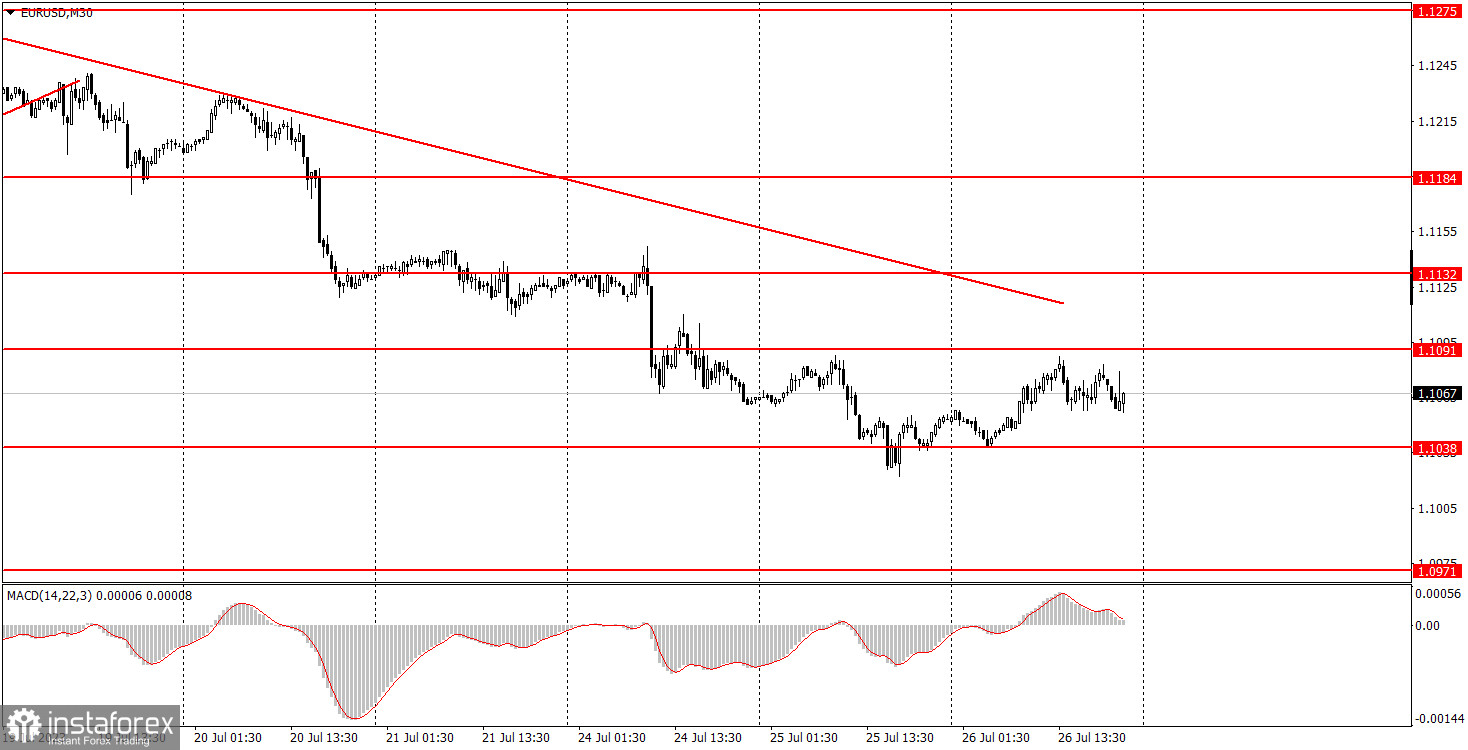
The EUR/USD pair did not budge on Wednesday. Volatility was only 50 pips, and there was visibly no trend. The downtrend persists since the pair has yet to breach the descending trendline. There were hardly any macroeconomic reports, except for the New Home Sales report in the United States, which traders brushed off. The market was entirely focused on the FOMC meeting.
As expected, the Federal Reserve raised its interest rate by another 0.25%. This decision was highly anticipated. Volatility started to increase only when Fed Chair Jerome Powell began his speech, but by that time, beginners should have already left the market. Therefore, all conclusions about the meeting will have to be made on Thursday.
EUR/USD on 5M chart

If we look at the 5-minute chart, we can see that there was a slight upward bias on Wednesday, but with 50 pips of volatility, it had no significant impact. The price bounced off the level of 1.1038 during the night, and with the opening of the European trading session, newcomers could have opened long positions, as the price had moved away from the formation point by then. It was wise to manually close the position before the release of the FOMC meeting results, as it could have resulted in a profit of about 30 pips, which is quite decent for a flat day. We do not consider any movements after 18:00 GMT.
Trading tips on Thursday:
On the 30M chart, the pair extends its downward movement, but it could also breach the trendline. We believe that you shouldn't focus on the signals formed on central bank meetings since the market often trades impulsively on such days. And since the movements can be very strong, it's better to wait for the market to calm down. The key levels on the 5M chart are 1.0901, 1.0932, 1.0971-1.0977, 1.1038, 1.1091, 1.1132-1.1145, 1.1184, 1.1241, 1.1279-1.1292, 1.1330, and 1.1367. A stop loss can be set at a breakeven point as soon as the price moves 15 pips in the right direction. On Thursday, the European Central Bank will announce the results of its meeting, and after that ECB President Christine Lagarde will hold a press conference. The US will release reports on GDP for the second quarter and Durable Goods Orders. As we can see, there will be quite a few important events, this should be sufficient to stir some market reaction, so the volatility may gradually increase.
Basic trading rules:
1) The strength of the signal depends on the time period during which the signal was formed (a rebound or a break). The shorter this period, the stronger the signal.
2) If two or more trades were opened at some level following false signals, i.e. those signals that did not lead the price to Take Profit level or the nearest target levels, then any consequent signals near this level should be ignored.
3) During the flat trend, any currency pair may form a lot of false signals or do not produce any signals at all. In any case, the flat trend is not the best condition for trading.
4) Trades are opened in the time period between the beginning of the European session and until the middle of the American one when all deals should be closed manually.
5) We can pay attention to the MACD signals in the 30M time frame only if there is good volatility and a definite trend confirmed by a trend line or a trend channel.
6) If two key levels are too close to each other (about 5-15 pips), then this is a support or resistance area.
How to read charts:
Support and Resistance price levels can serve as targets when buying or selling. You can place Take Profit levels near them.
Red lines are channels or trend lines that display the current trend and show which direction is better to trade.
MACD indicator (14,22,3) is a histogram and a signal line showing when it is better to enter the market when they cross. This indicator is better to be used in combination with trend channels or trend lines.
Important speeches and reports that are always reflected in the economic calendars can greatly influence the movement of a currency pair. Therefore, during such events, it is recommended to trade as carefully as possible or exit the market in order to avoid a sharp price reversal against the previous movement.
Beginners should remember that every trade cannot be profitable. The development of a reliable strategy and money management are the key to success in trading over a long period of time.