Analyzing Tuesday's trades:
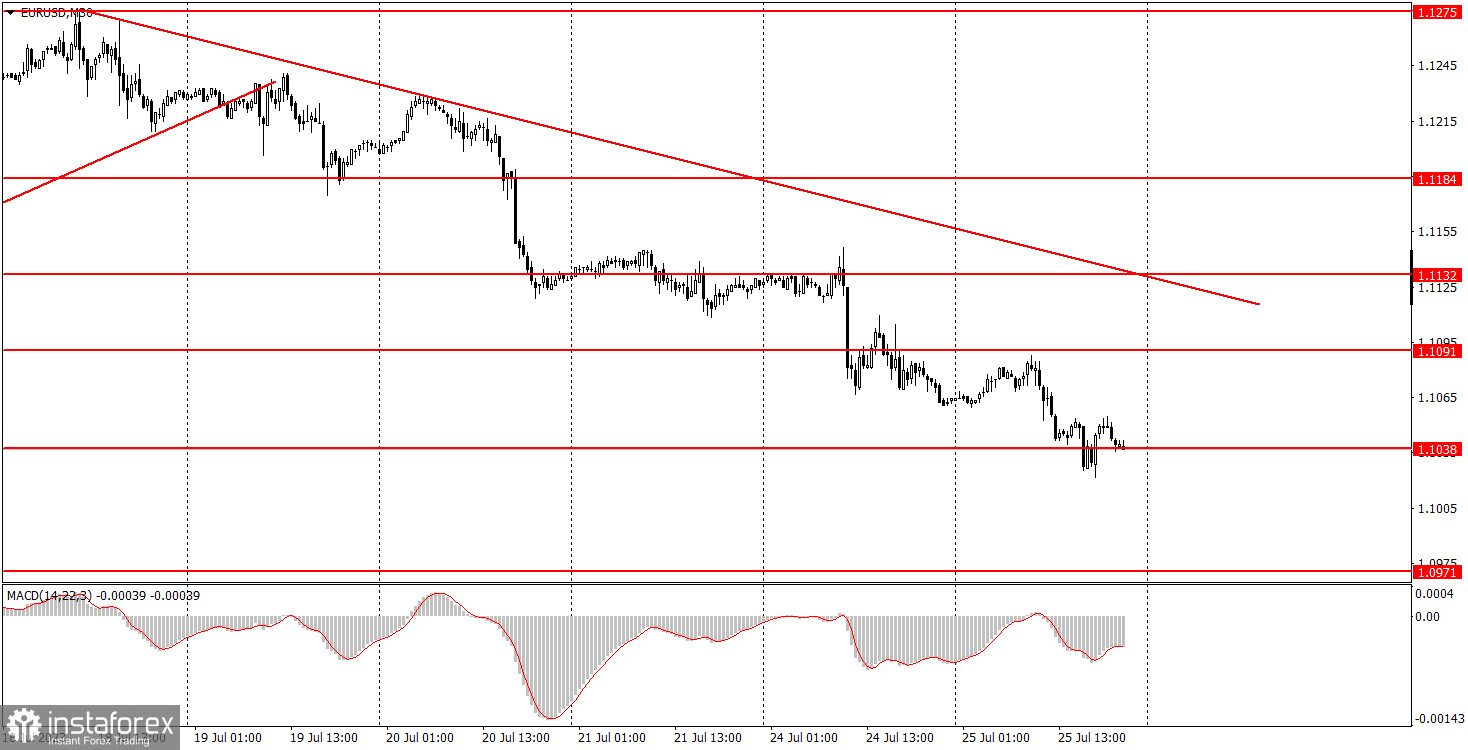
EUR/USD on 30M chart

On Tuesday, the EUR/USD pair continued to trade lower, following the general downtrend. There were no significant economic reports or fundamental events that could have prompted this decline. Nevertheless, the current depreciation of the euro seems to be the most logical outcome among all possible scenarios. Take note that the euro has been rising for the past 10 months, so a correction is not surprising. Markets prepare for the upcoming meetings of the Federal Reserve (on Wednesday) and the European Central Bank (on Thursday). However, it is difficult to explain why the US dollar is getting stronger now. It has been depreciating for the past 10 months, even when the Fed was aggressively raising rates and was quicker compared to the ECB. Both central banks are expected to raise rates by 0.25% each.
EUR/USD on 5M chart

The movements on the 5-minute chart weren't favorable, and volatility was 65 pips. During the European session, the price missed the 1.1091 mark by just three pips; otherwise, this would have been a great sell signal. All three signals formed around the level of 1.1038 were false. It might not have been worth executing them, considering that the pair had already fallen by an amount equal to the average volatility of the last 5 and 30 days. Despite the prevailing trend, the current movements are not the best. It would be more reasonable to trade on higher time frames, where there is no need to react to every upward reversal, which turns out to be a mere pullback, and intra-day flat periods are offset by the time frame.
Trading tips on Wednesday:
On the 30M chart, the pair extends its downward movement. The expectation is that this downtrend will continue, regardless of any fundamental background or central bank decisions. The new descending trend line is currently supporting sellers, so we don't expect the euro to start a new wave of growth at the moment. The key levels on the 5M chart are 1.0901, 1.0932, 1.0971-1.0977, 1.1038, 1.1091, 1.1132-1.1145, 1.1184, 1.1241, 1.1279-1.1292, 1.1330, 1.1367. A stop loss can be set at a breakeven point as soon as the price moves 15 pips in the right direction. No significant events lined up in the European Union. The main items on today's agenda will be the Fed meeting and Fed Chair Jerome Powell's speech. We should brace ourselves for high volatility and fluctuations in various directions in the evening.
Basic trading rules:
1) The strength of the signal depends on the time period during which the signal was formed (a rebound or a break). The shorter this period, the stronger the signal.
2) If two or more trades were opened at some level following false signals, i.e. those signals that did not lead the price to Take Profit level or the nearest target levels, then any consequent signals near this level should be ignored.
3) During the flat trend, any currency pair may form a lot of false signals or do not produce any signals at all. In any case, the flat trend is not the best condition for trading.
4) Trades are opened in the time period between the beginning of the European session and until the middle of the American one when all deals should be closed manually.
5) We can pay attention to the MACD signals in the 30M time frame only if there is good volatility and a definite trend confirmed by a trend line or a trend channel.
6) If two key levels are too close to each other (about 5-15 pips), then this is a support or resistance area.
How to read charts:
Support and Resistance price levels can serve as targets when buying or selling. You can place Take Profit levels near them.
Red lines are channels or trend lines that display the current trend and show which direction is better to trade.
MACD indicator (14,22,3) is a histogram and a signal line showing when it is better to enter the market when they cross. This indicator is better to be used in combination with trend channels or trend lines.
Important speeches and reports that are always reflected in the economic calendars can greatly influence the movement of a currency pair. Therefore, during such events, it is recommended to trade as carefully as possible or exit the market in order to avoid a sharp price reversal against the previous movement.
Beginners should remember that every trade cannot be profitable. The development of a reliable strategy and money management are the key to success in trading over a long period of time.
 English
 Русский
 Bahasa Indonesia
 Bahasa Malay
 ไทย
ไทย Español
 Deutsch
 Български
 Français
 Tiếng Việt
 中文
中文 বাংলা
বাংলা हिन्दी
 Čeština
 Українська
 Română

