Analysis of GBP/USD 5M

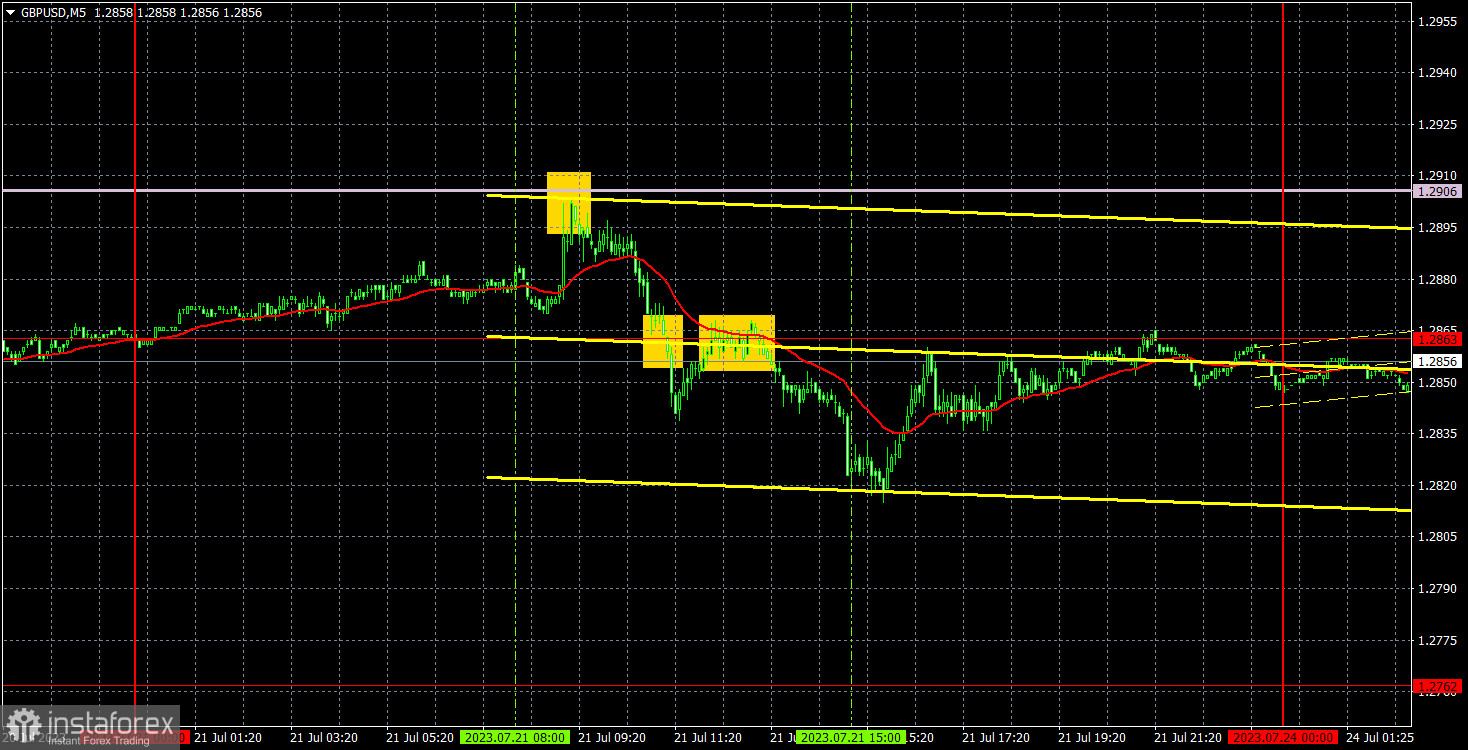
GBP/USD was losing ground for the sixth consecutive session. This time, the decline was not as strong, but this was in the absence of influential economic releases. In addition, the pair had been falling throughout the previous week, and it seems like the party is over for the pound. The UK retail sales report turned out to be stronger than expected but did not provide strong support to the buyers. For several months, we have been reiterating the same point: the pound is extremely overbought and should continue to fall regardless of the fundamental background. Therefore, a downward movement seems logical and consistent. However, on the hourly chart, the price is approaching an ascending trendline, which could potentially lead to a bounce. Despite falling by a few hundred pips, the pound could still bring back its illogical and unfounded uptrend, especially before the meetings of the Bank of England and the Federal Reserve.
The trading signals on Friday were not the worst, but the pair was not as stagnant as the EUR/USD. Initially, there was a bounce from the Senkou Span B line, after which the pair dropped and broke through the level of 1.2863, only to bounce back from below it later. By the end of the day, the price managed to fall and return to the level of 1.2863, but there was no buy signal. As a result, traders could only open one short position, which yielded around 40-50 pips, which is quite good.
COT report:

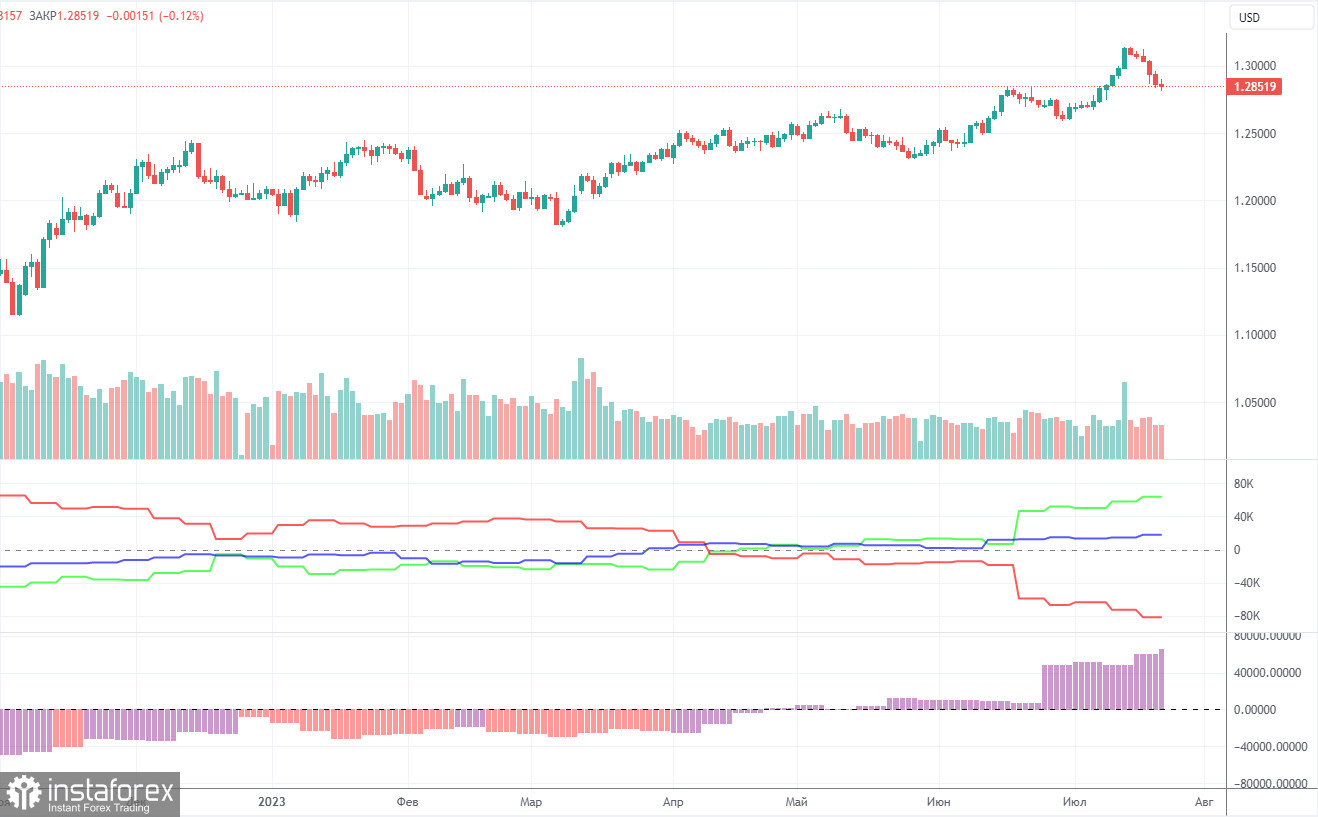
According to the latest report, the non-commercial group of traders opened 23,600 long positions and 17,900 short ones. Thus, the net position of non-commercial traders rose by 5,700 positions in a week. It continued to rise. The net position has been steadily growing over the past 10 months as well as the pound sterling. Now, the net position has advanced markedly. This is why the pair will hardly maintain its bullish momentum. I believe that a long and protracted downward movement should begin. COT reports signal a slight growth of the British currency but it will not be able to rise in the long term. There are no drivers for opening new long positions. However, there are no technical signals for short positions yet.
The British currency has already grown by a total of 2,800 pips. Without a downward correction, the continuation of the uptrend will be illogical. The Non-commercial group of traders has opened 135,200 long positions and 71,500 short ones. I remain skeptical about the long-term growth of the pound sterling but speculators continue to buy because the pair is growing.
Analysis of GBP/USD 1H

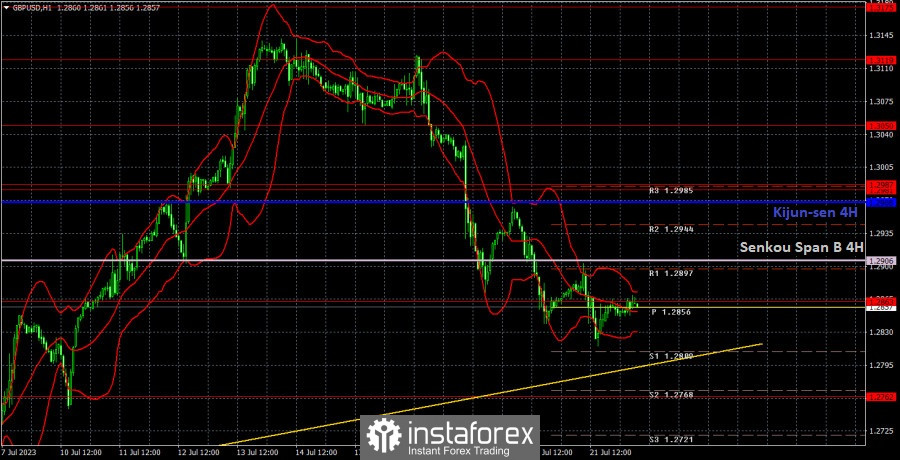
On the 1H chart, the pound/dollar pair maintains an uptrend. It declined below both lines of the Ichimoku indicator, which signals a correction. The market sentiment has not completely changed to bearish as the ascending trend line remains relevant. Thus, the pair can resume growth at any moment. Nevertheless, the pound sterling began to fall. It has been falling for a week. Therefore, a steady downtrend is likely to start.
On July 24, traders should pay attention to the following key levels: 1.2598-1.2605, 1.2693, 1.2762, 1.2863, 1.2981-1.2987, 1.3050, 1.3119, 1.3175, 1.3222, 1.3273. The Senkou Span B line (1.2906) and the Kijun-sen line (1.2968) lines can also provide signals, e.g. rebounds and breakout of these levels and lines. It is recommended to set the Stop Loss orders at the breakeven level when the price moves in the right direction by 20 pips. The lines of the Ichimoku indicator can move during the day, which should be taken into account when determining trading signals. There are support and resistance levels that can be used to lock in profits.
The UK and the US are set to release their own respective PMIs. British gauges are more important for traders since the US focuses more on ISM gauges than those of the S&P. A restrained market reaction may follow after these reports, but it is unlikely to change the overall market sentiment.
Description of the chart:
Support and resistance levels are thick red lines near which the trend may end. They do not provide trading signals;
The Kijun-sen and Senkou Span B lines are the lines of the Ichimoku indicator, plotted to the 1H timeframe from the 4H one. They provide trading signals;
Extreme levels are thin red lines from which the price bounced earlier. They provide trading signals;
Yellow lines are trend lines, trend channels, and any other technical patterns;
Indicator 1 on the COT charts is the net position size for each category of traders;
Indicator 2 on the COT charts is the net position size for the Non-commercial group.
 English
 Русский
 Bahasa Indonesia
 Bahasa Malay
 ไทย
ไทย Español
 Deutsch
 Български
 Français
 Tiếng Việt
 中文
中文 বাংলা
বাংলা हिन्दी
 Čeština
 Українська
 Română

