Bitcoin's Price Correction: Heading towards $40k
Crypto Industry News:
Recent data indicates that the average Bitcoin transaction fee was nearly $40 as of December 17. Miners are benefitting from this scenario, but average users may be less pleased.
High Transaction Fees
The resurgence of Bitcoin Ordinals, a form of "Bitcoin NFTs", has led to increased network transaction fees. As per BitInfoCharts, the current average cost to send BTC is just over $37 - the highest since April 2021.
There's a significant volume of unconfirmed transactions on the blockchain. Transactions with lower fees, such as $2, are not prioritized. Currently, about 350,000 transactions are pending confirmation.

The impact of Ordinals on transaction fees has sparked investor concern. Future scenarios may necessitate using layer 2 solutions like the Lightning Network, designed for mass adoption and high bitcoin demand.
Technical Market Outlook:
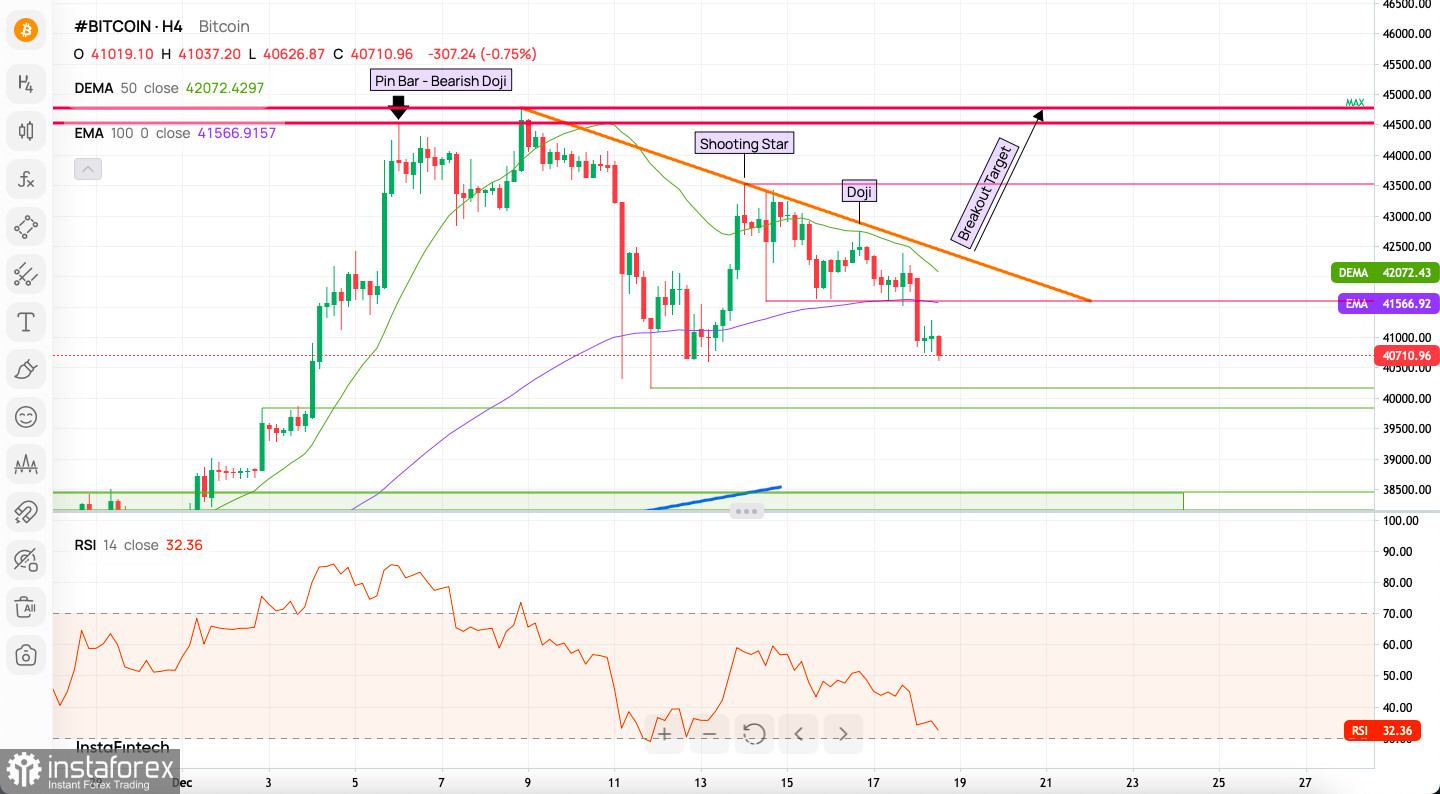
BTC/USD has reversed from its high of $43,515, forming a Shooting Star pattern on the H4 chart. Resistance is found at $42,424 and $42,851. The market is moving towards $40,000 and remains below the short-term trend line resistance. A breakout above the trend line and $41,610 is needed for a bullish shift.
Bulls aim for $48,200, the weekly high from March 28, 2022. The key demand zone on the H4 chart lies between $38,477 and $38,029. A breakout below this zone would indicate a bearish short-term trend.
Weekly Pivot Points:
- WR3 - $42,296
- WR2 - $41,640
- WR1 - $41,121
- Weekly Pivot - $40,983
- WS1 - $40,557
- WS2 - $40,382
- WS3 - $39,673
Trading Outlook:
The next long term target for the bulls is set at $48,200 as the potential for a sustained long-term uptrend remains, provided the critical level of $19,572 is not decisively violated. The key long-term technical support is located at the level of $32,829 and $31,790.
Intraday H1 Indicator Signals:
- Sell signals: 20 out of 21 indicators
- Buy signals: 1 indicator
- Moving averages: 16 Buy, 2 Sell
Sentiment Scoreboard:
Current sentiment is bullish (74% bulls vs. 26% bears). Last week and the past three days also showed bullish sentiment.
Conclusions and Trading Insights:
With the market approaching $40,000, traders should monitor the key support levels and the potential breakout points. Long-term bullish potential remains, but caution is advised due to high volatility and shifting sentiments. Monitor pivot points and sentiment indicators for optimal trading decisions.
Useful Links
Important Reminder
The begginers in forex trading need to be very careful when making decisions about entering the market. Before the release of important reports, it is best to stay out of the market to avoid being caught in sharp market fluctuations due to increased volatility. If you decide to trade during the news release, then always place stop orders to minimize losses.
Without placing stop orders, you can very quickly lose your entire deposit, especially if you do not use money management and trade large volumes. For successful trading, you need to have a clear trading plan and stay focues and disciplined. Spontaneous trading decision based on the current market situation is an inherently losing strategy for a scalper or daytrader.
 English
 Русский
 Bahasa Indonesia
 Bahasa Malay
 ไทย
ไทย Español
 Deutsch
 Български
 Français
 Tiếng Việt
 中文
中文 বাংলা
বাংলা हिन्दी
 Čeština
 Українська
 Română

