Details of the economic calendar on July 19
UK inflation slowed down to its lowest level since March 2022 last month. The annual increase in consumer prices reached 7.9%, which was below experts' forecasts of an inflation slowdown to 8.2%. This led to market speculation and a weakening of the British currency, as expectations regarding the Bank of England's interest rate hike changed.
On the other hand, the final inflation data in the European Union had no significant impact on the market, as it fully matched the preliminary estimate, indicating a slowdown in the growth rate of consumer prices from 6.1% to 5.5%. This fact was already priced in by the market.
During the American trading session, data on a decline in the construction sector was published. This negative factor for the economy once again raised concerns about the possibility of a recession.

Analysis of trading charts from July 19
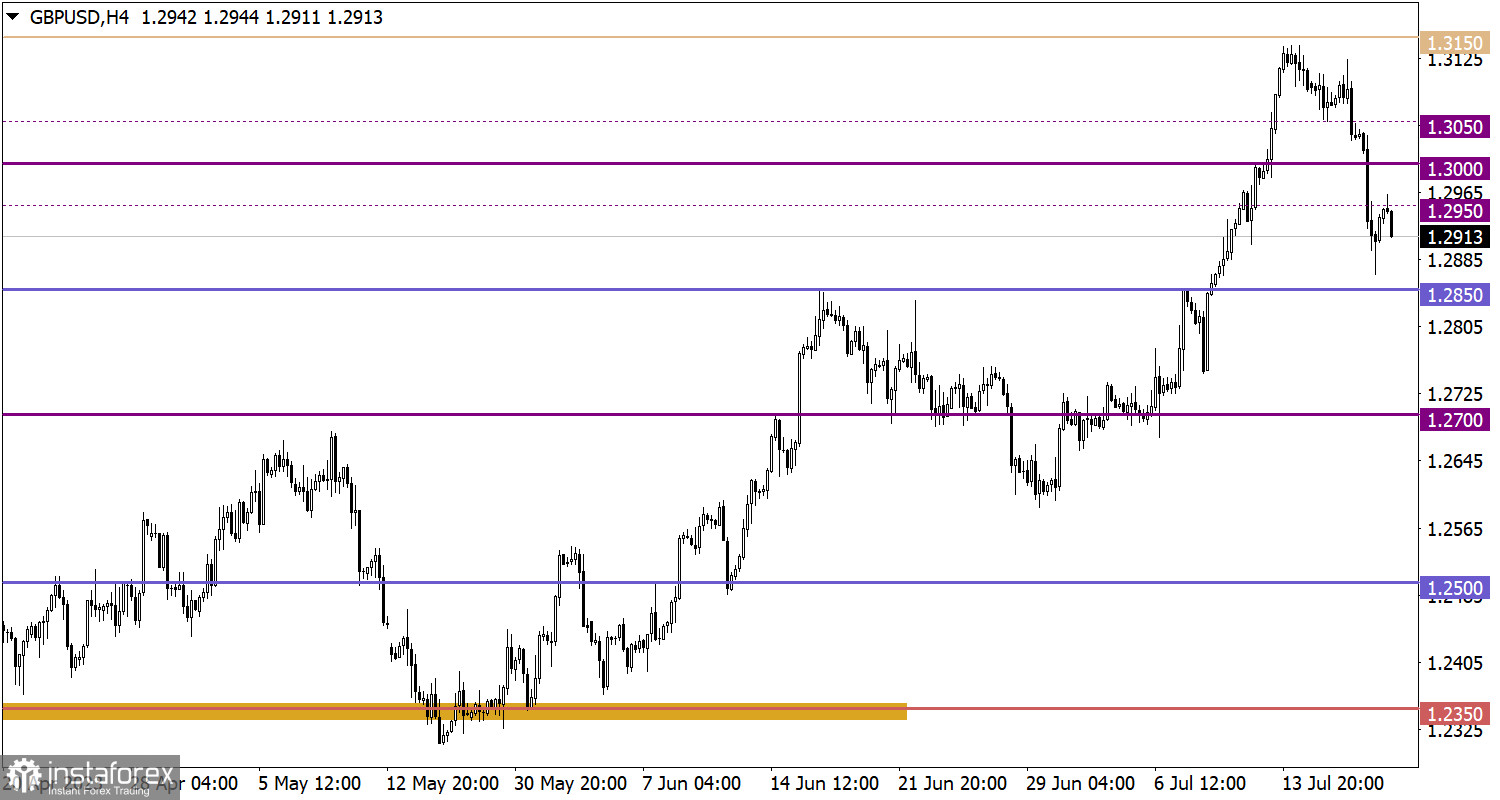
The GBP/USD currency pair experienced a speculative-inertial move, losing about 1% in value, which is more than 200 points. Such an intense and rapid price change led to an overheating of short positions on the British currency. As a result, there was a technical pullback from the region of 1.2850.
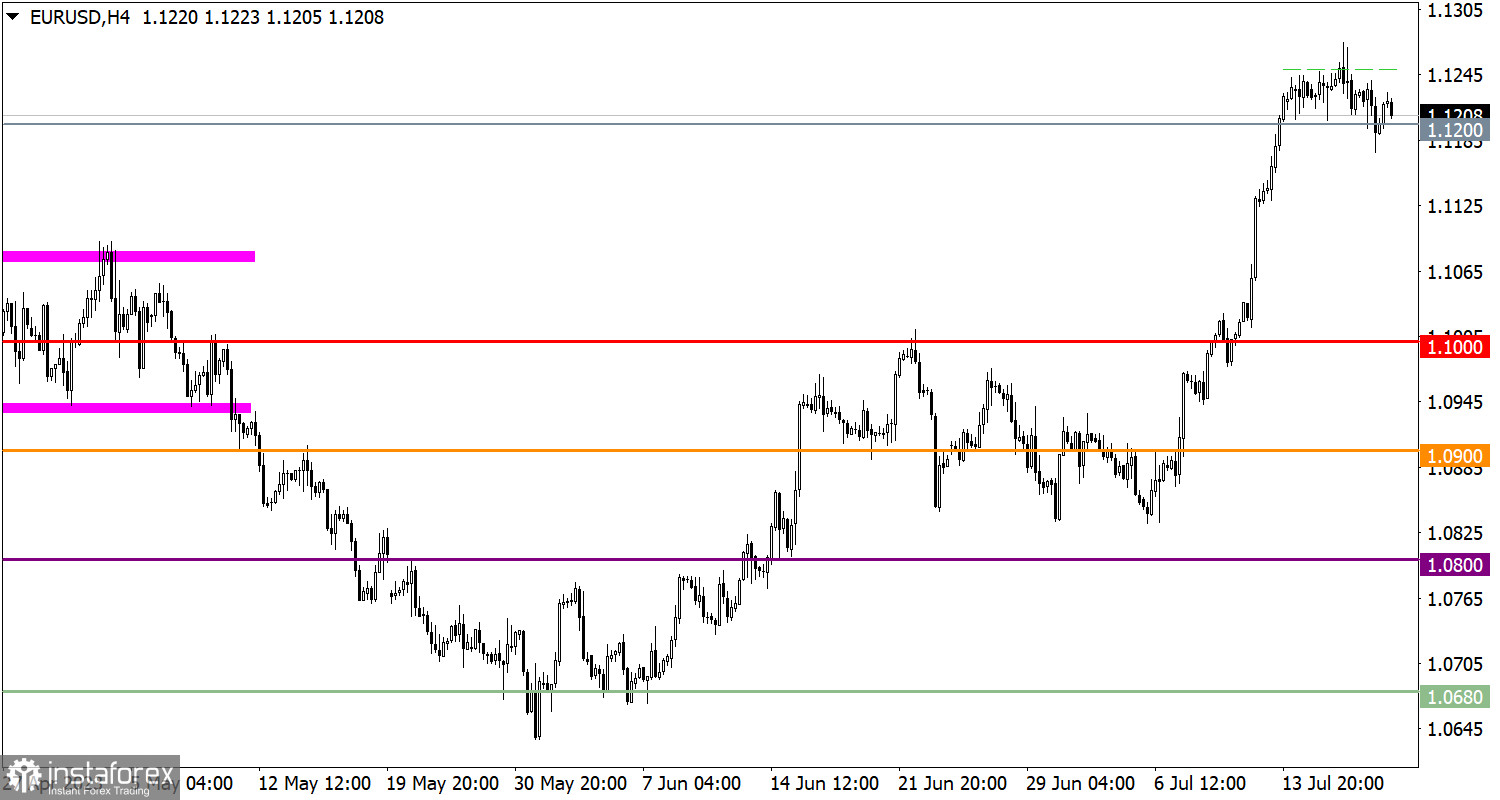
The EUR/USD pair, through positive correlation with the British currency, also weaken. However, this weakening was of a local nature, as the quote returned above the 1.1200 level during the American trading session.
Economic calendar for July 20
Today, data on jobless claims in the United States is expected to be published, with forecasts indicating an overall increase. Statistical data details suggest that the volume of continuing claims may remain at 1.729 million, while the volume of initial claims may increase from 237,000 to 242,000.
Time targeting:
U.S. Jobless Claims – 12:30 UTC
GBP/USD trading plan for July 20
As a resistance level for the pullback, the lower range of the psychological level 1.2950/1.3000 has emerged, leading to a reduction in long positions' volume. To sustain the current downward market cycle, the quote needs to stay below the 1.2850 level. As for the upward scenario, initial signals of the correction phase ending will appear after the price returns above the 1.3000 level.

EUR/USD trading plan for July 20
In this situation, the focus remains on the stagnation that occurred at the peak of the upward trend. The levels 1.1200 and 1.1250 are critical values within which the price fluctuations are happening. If the price consistently holds outside of either of these levels, it may indicate the subsequent direction of the price movement. For now, the market remains in a state of stagnation.

What's on the charts
The candlestick chart type is white and black graphic rectangles with lines above and below. With a detailed analysis of each individual candle, you can see its characteristics relative to a particular time frame: opening price, closing price, intraday high and low.
Horizontal levels are price coordinates, relative to which a price may stop or reverse its trajectory. In the market, these levels are called support and resistance.
Circles and rectangles are highlighted examples where the price reversed in history. This color highlighting indicates horizontal lines that may put pressure on the asset's price in the future.
The up/down arrows are landmarks of the possible price direction in the future.
 English
 Русский
 Bahasa Indonesia
 Bahasa Malay
 ไทย
ไทย Español
 Deutsch
 Български
 Français
 Tiếng Việt
 中文
中文 বাংলা
বাংলা हिन्दी
 Čeština
 Українська
 Română

