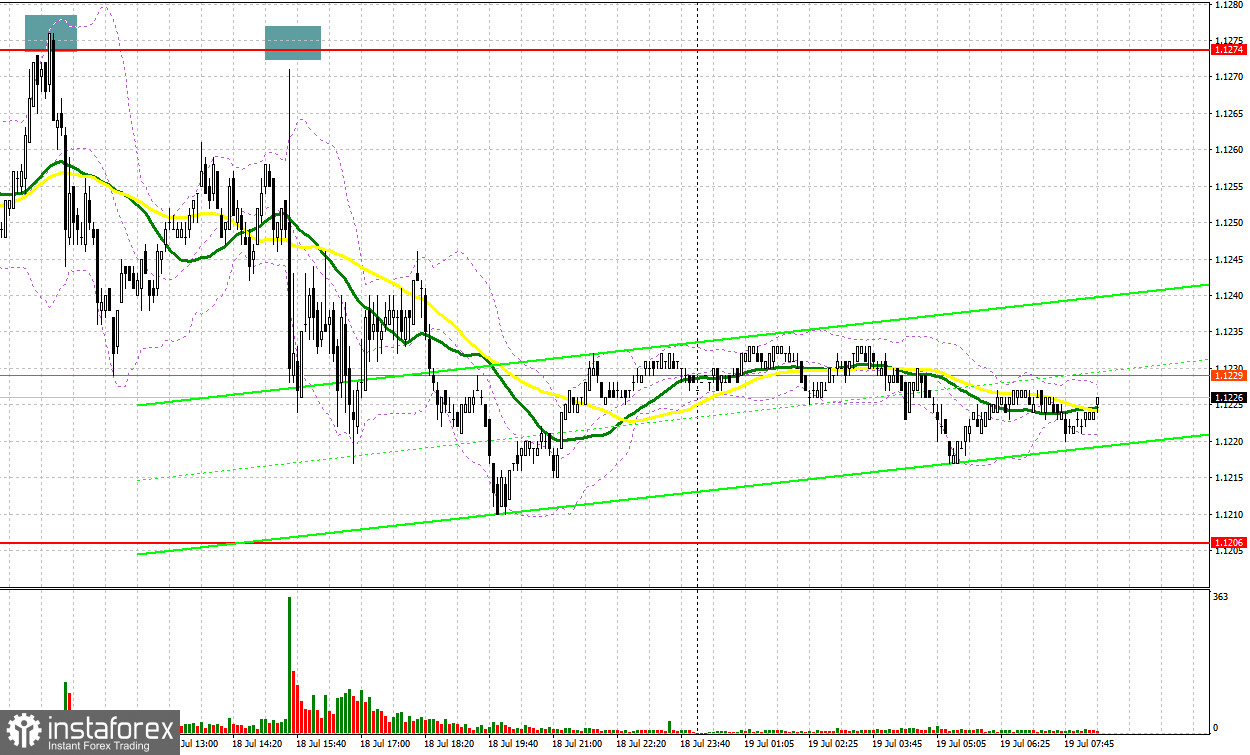
Yesterday, several excellent entry signals were formed in the market. Let us take a look at the 5-minute chart and analyze what happened. In my morning forecast, I highlighted the level of 1.1242 and recommended making entry decisions with this level in mind. A false breakout of this level created a buy signal, propelling the pair more than 30 pips higher. However, the bears defended the 1.1276 mark, causing a retracement back towards the 1.1240 zone. In the second half of the day, the pair failed to reach 1.1274 after the release of retail sales data, and I missed the sell signal there.

When to open long positions on EUR/USD:
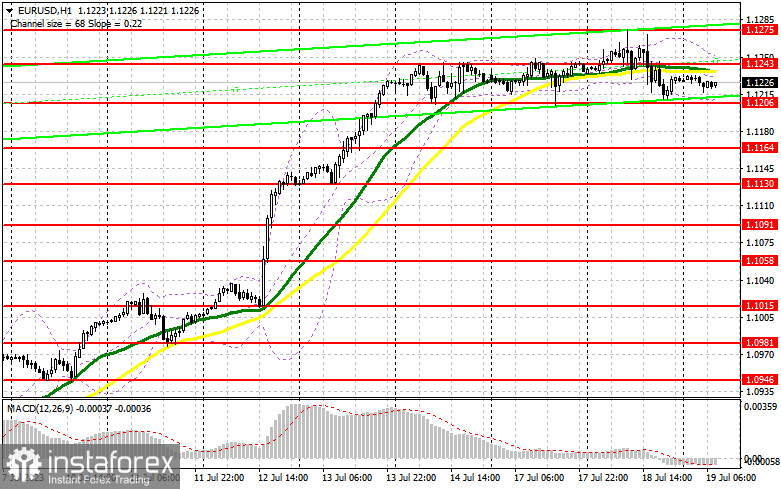
The US retail sales data caused a spike in volatility, but did not significantly impact the market dynamics. Today's key data release will be the Eurozone CPI data. The core CPI, which is closely monitored by the European Central Bank, will be particularly important. Any significant decrease may intensify sellside pressure on the euro, leading to a swift downward movement of EUR/USD. In such a scenario, bullish traders should only act around the support level of 1.1206, which was formed last Friday. A decline and a false breakout of that level will provide a buy signal, leading to an upward move targeting the resistance at 1.1243. The moving averages in that area favor the bears. A breakout and a downward retest of this level will increase demand for EUR and could pave the way for an attempt to reach a new yearly high at 1.1275. The most distant target remains around 1.1310, where I will take profits.
If EUR/USD declines and there are no buyers at 1.1206, considering the euro's overbought conditions along with potentially weak Eurozone inflation data, pressure on EUR/USD will increase. In this case, only a false breakout of the next support level at 1.1164 will create a buy signal. I will open long positions immediately if EUR/USD bounces off the low of 1.1130, targeting an intraday correction of 30-35 pips.
When to open short positions on EUR/USD:
Today presents an opportunity for bearish to establish a downward correction. To do so, they will need to focus on protecting the nearest resistance at 1.1243. Otherwise, avoiding further development of the bullish scenario will be unlikely. I will preferably to act only after the pair increases and performs a false breakout of that leve amid weak Eurozone core CPI data for June. Such a move will create a sell signal and might send EUR/USD down towards the support at 1.1206, where major buyers are expected to emerge. However, this level has already been tested multiple times, and a bearish breakthrough is plausible. Should the pair break below the level and consolidate there, coupled with an upward retest amid weak Eurozone statistics, a sell signal might be generated, setting the stage for a direct move towards 1.1164. This would indicate a significant euro correction, potentially sparking the interest of bullish traders. The most distant target in this case will be around 1.1130, where I will take profits.

In the unlikely event that EUR/USD trends higher during the European session, and bears are idle around 1.1243, bulls will continue to control the market. In this case, I will hold off opening short positions until the pair reaches the next resistance at 1.1275. New short positions can be opened there, but only after an unsuccessful consolidation. I will open short positions immediately if EUR/USD bounces off the high of 1.1310, targeting an intraday correction of 30-35 pips.
Commitment of Traders (COT) report:
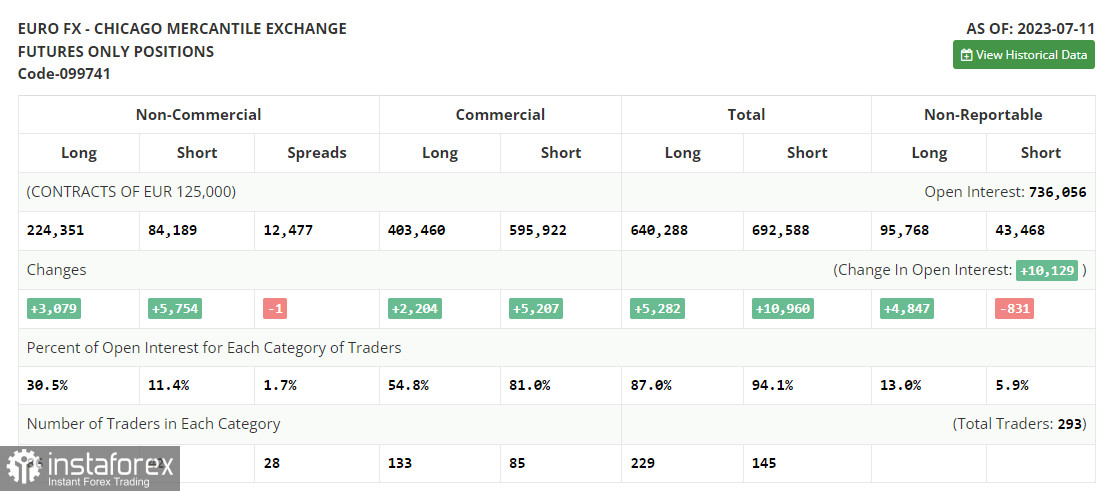
The Commitment of Traders (COT) report for July 11 showed that both long and short positions increased, maintaining the market balance in favor of euro bulls. The released inflation data in the US, indicating a sharp slowdown, particularly in core prices, significantly influenced euro bulls. As a result, EUR/USD to break yearly highs beyond the psychological 1.1000 level, which had remained untouched for nearly six months. The fact that the Federal Reserve no longer needs to raise interest rates makes the US dollar relatively weak. While the market remains bullish, buying euro on dips remains the optimal medium-term strategy in the current conditions. The COT report indicates that non-commercial long positions increased by 3,079 to 223,351, while non-commercial short positions jumped by 5,754 to 84,189. The overall non-commercial net position slightly decreased to 140,162 from 142,837. The weekly closing price rose to 1.1037 from 1.0953.

Indicator signals:
Moving Averages
Trading is taking place around the 30-day and 50-day moving averages, indicating a sideways market trend.
Note: The author considers the period and prices of the moving averages on the hourly chart (H1), which differs from the general definition of classical daily moving averages on the daily chart (D1).
Bollinger Bands
If the pair declines, the lower boundary of the indicator near 1.1206 will act as support.
Description of indicators
Moving average (moving average, determines the current trend by smoothing out volatility and noise). Period 50. It is marked yellow on the chart. Moving average (moving average, determines the current trend by smoothing out volatility and noise). Period 30. It is marked green on the chart. MACD indicator (Moving Average Convergence/Divergence - convergence/divergence of moving averages) Quick EMA period 12. Slow EMA period to 26. SMA period 9 Bollinger Bands (Bollinger Bands). Period 20 Non-commercial speculative traders, such as individual traders, hedge funds, and large institutions that use the futures market for speculative purposes and meet certain requirements. Long non-commercial positions represent the total long open position of non-commercial traders. Short non-commercial positions represent the total short open position of non-commercial traders. Total non-commercial net position is the difference between the short and long positions of non-commercial traders. English
 Русский
 Bahasa Indonesia
 Bahasa Malay
 ไทย
ไทย Español
 Deutsch
 Български
 Français
 Tiếng Việt
 中文
中文 বাংলা
বাংলা हिन्दी
 Čeština
 Українська
 Română

