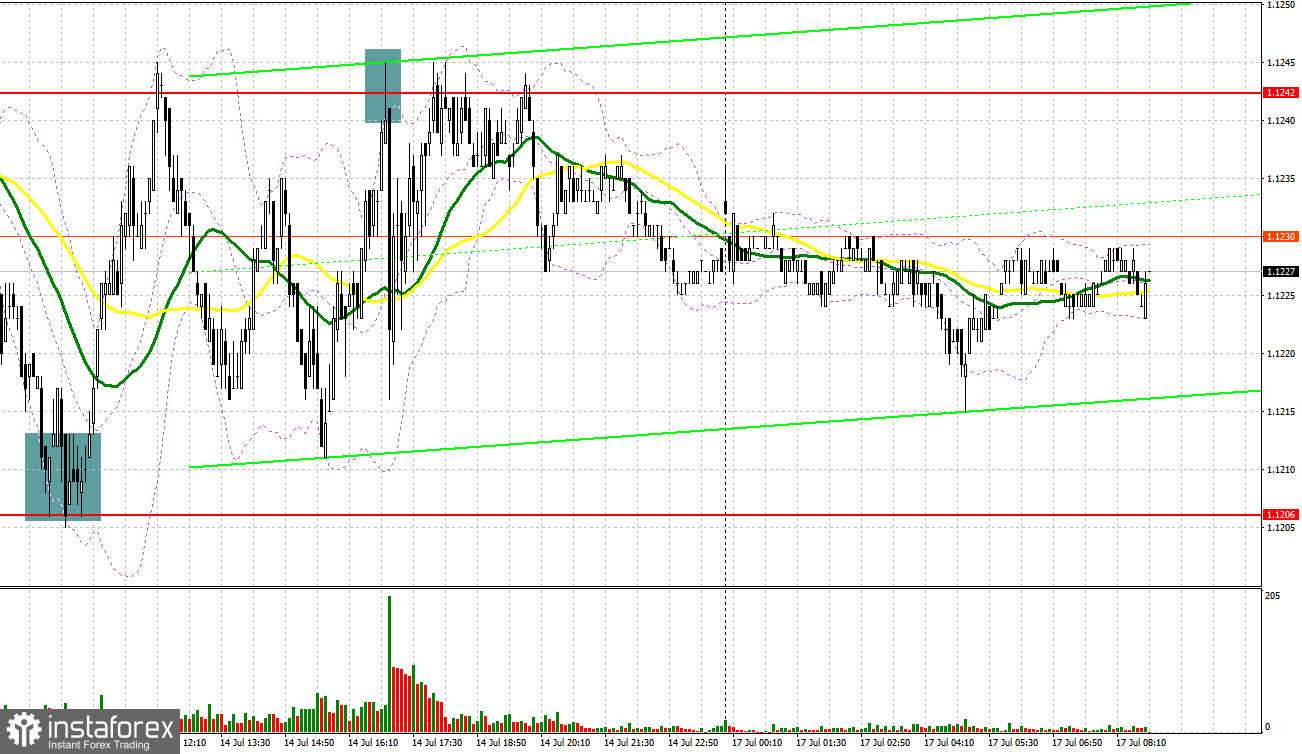
Last Friday, there were several excellent entry points. Let's look at the 5-minute chart and figure out what actually happened. In my morning forecast, I turned your attention to the level of 1.1216 and recommended making decisions with this level in focus. A false breakout of this level gave a buy signal, which resulted in an upward movement of 25 pips. In the afternoon, the protection of the resistance level of 1.1242 led to a sell signal, which kept the pair within the sideways channel. It brought about 20 pips of profit.
 When to open long positions on EUR/USD:
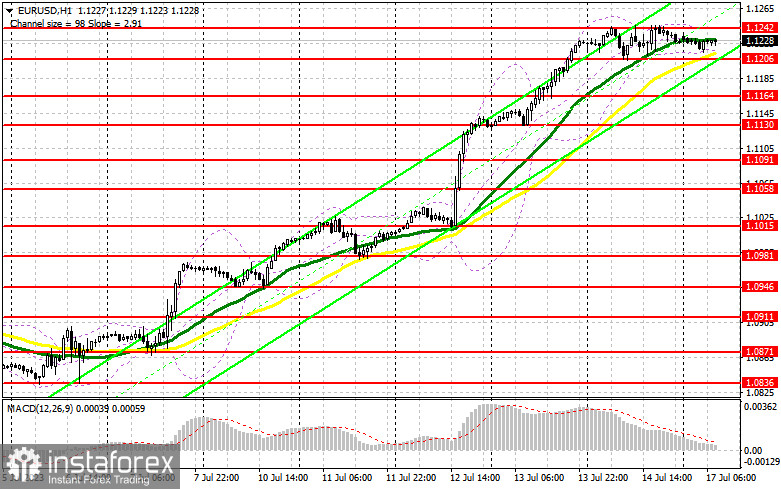
Given that Friday's market reaction to the strong data on the Michigan University Consumer Sentient was rather muted. Apparently, there are much more people willing to buy the euro now than to sell it. Today, Italy's Consumer Price Index is on tap. Apart from that, ECB President Christine Lagarde will deliver the speech. It might help the pair to reach a new annual high. If the pressure on the pair returns after Lagarde's speech, it is better to open positions at the support of 1.1206 formed last Friday. A decrease and a false breakout of this level will give a buy signal. The pair is likely to jump to the resistance level of 1.1242. A breakout and a downward retest of this level will bolster demand for the euro, pushing it to a new annual high of 1.1276. A more distant target remains the 1.1310 level where I recommend locking in profits. If EUR/USD declines and bulls fail to defend 1.1206, which is highly likely given the overbought status of the euro, the pressure on EUR/USD will increase. Therefore, only a false breakout of the support level of 1.1164 may create entry points into long positions. You could buy EUR/USD at a bounce from 1.1130, keeping in mind an upward intraday correction of 30-35 pips.
When to open short positions on EUR/USD:
Sellers could start a downward correction. To do so, they need to protect the resistance level of 1.1242. Otherwise, the bullish bias will persist. I would advise you to go short at this level only after growth and a false breakout, similar to the one I have discussed above. If Christine Lagarde's rhetoric is dovish, which is unlikely, it will provide a sell signal with the prospect of a decline to the support level of 1.1206. At this level, big sellers may enter the market. However, in case of a breakout and consolidation below this level as well as an upward retest amid weak EU data, there may be a sell signal that could push the pair to 1.1164. This will indicate a large correction of the euro, which may facilitate a bull market. A more distant target will be the 1.1130 level where I recommend locking in profits.
 If EUR/USD rises during the European session and bears fail to protect 1.1242, which is more likely given the uptrend, the bulls will continue to control the market. In this case, I would advise you to postpone short positions until a false breakout of the resistance level of 1.1276. You could sell EUR/USD at a bounce from 1.1310, keeping in mind a downward intraday correction of 30-35 pips.
COT report
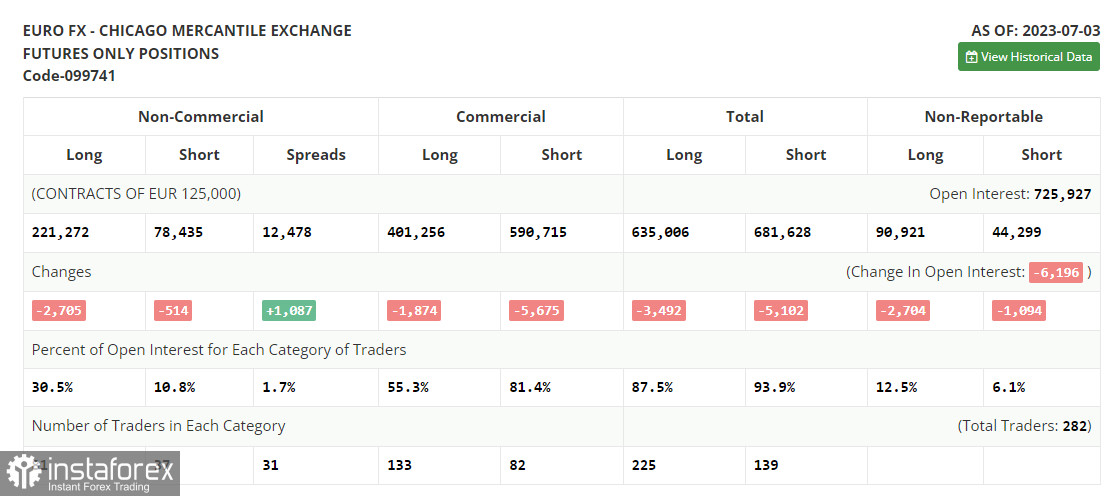
According to the COT report (Commitment of Traders) for July 3, there was a drop in long and short positions. As a result, the market sentiment remained unchanged. The US labor market data showed the first signs of cooling. It is bullish for risk assets as well as traders who expect further aggressive tightening from the central banks of their countries. However, the Fed could take a pause. Many analysts believe that traders have already riced in the upcoming rate hikes. If fresh reports signal a decrease in inflation, it may lead to a larger sell-off of the US dollar. The medium-term strategy in the current conditions is to go long on the decline. The COT report showed that long non-profit positions decreased by 2,705 to 221,272, while short non-profit positions fell by 514 to 78,435. At the end of the week, the total non-commercial net position slightly slid and amounted to 142,837 against 145,028. The weekly closing price come in at 1.0953 against 1.1006. Indicator signals:
Moving averages:
Trading is carried out near the 30-day and 50-day moving averages, which indicates a sideways movement.
Note: The author considers the period and prices of moving averages on the H1 (1-hour) chart that differ from the general definition of the classic daily moving averages on the daily D1 chart.
Bollinger Bands
If EUR/USD declines, the indicator's lower border at 1.1210 will serve as support.
Indicator description:
Moving average (MA) determines the current trend by smoothing volatility and noise. Period 50. Colored yellow on the chart.
Moving average (MA) determines the current trend by smoothing volatility and noise. Period 30. Colored green on the chart.
Moving Average Convergence/Divergence (MACD). Fast EMA 12. Slow EMA 26. SMA 9.
Bollinger Bands. Period 20
Non-commercial traders are speculators such as individual traders, hedge funds, and large institutions who use the futures market for speculative purposes and meet certain requirements.
Long non-commercial positions are the total long position of non-commercial traders.
Non-commercial short positions are the total short position of non-commercial traders.
Total non-commercial net position is the difference between the short and long positions of non-commercial traders.
 English
 Русский
 Bahasa Indonesia
 Bahasa Malay
 ไทย
ไทย Español
 Deutsch
 Български
 Français
 Tiếng Việt
 中文
中文 বাংলা
বাংলা हिन्दी
 Čeština
 Українська
 Română

