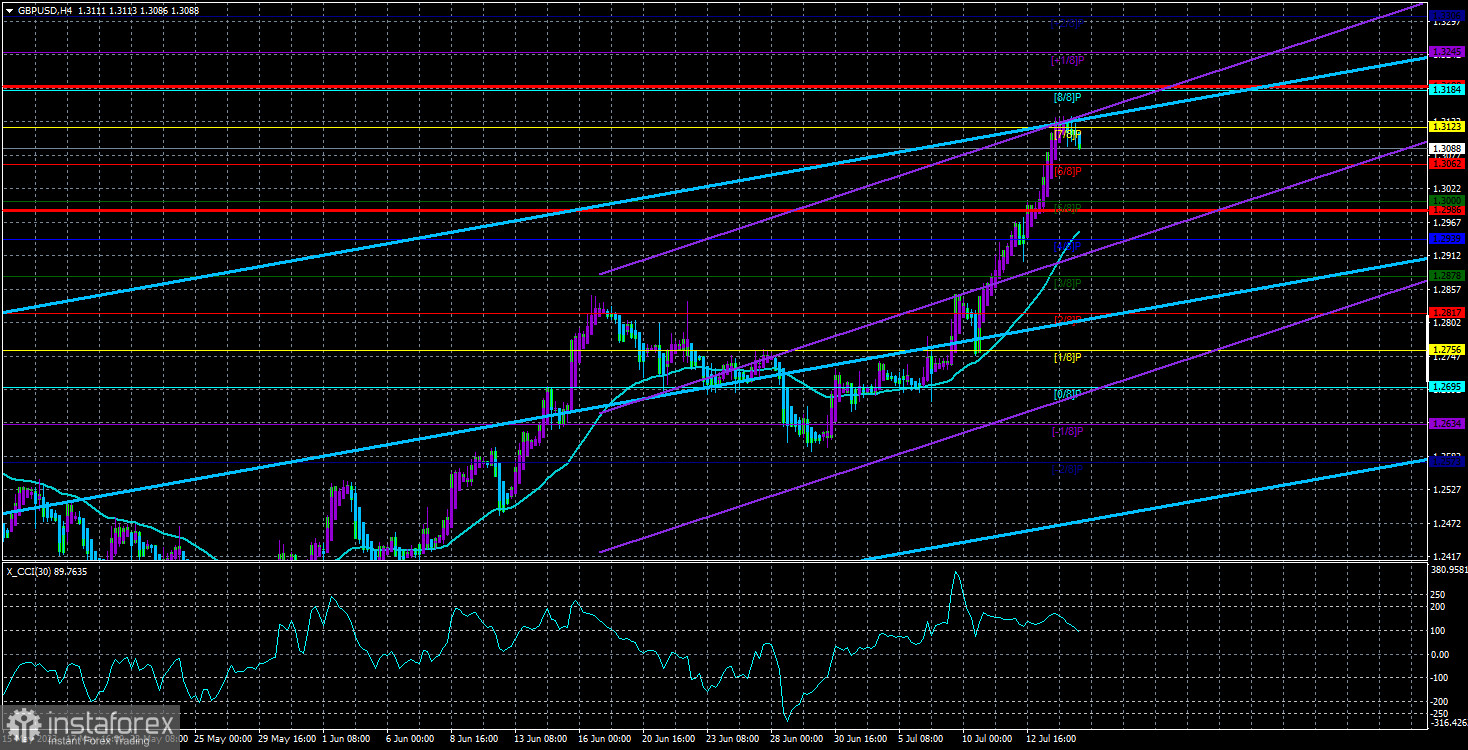
The GBP/USD currency pair rose calmly on Thursday and started a correction with volatility of about 50 points on Friday. In other words, it's the same situation as with the euro currency: there is practically no correction after the four-day rally of the pair. On Friday, only one consumer sentiment report was published for both countries. It showed significantly stronger growth than forecasted, but it didn't help the pair start a decline; instead, it strengthened the dollar. Thus, a strong, illogical, and inertial upward trend persists. However, it is still being determined how long it will continue since no clear and specific justifications exist.
There are no sell signals or indications of a trend reversal on the 4-hour and 24-hour timeframes. Therefore, it is not advisable to consider selling. At the same time, the pound may plummet at any moment, considering how long it has been rising practically without reason. Many major banks and analytical agencies worldwide have yet to try to find clear reasons for the growth of the British currency. Instead, they believe that any strong macroeconomic statistics from across the ocean are unfavorable for the dollar. It is difficult to explain how this works. Traders should focus only on technical analysis until signals of a return to reasonable market movements emerge.
The pound has a chance to rise even stronger.
There are significant events to pay attention to in the UK next week. On Wednesday, an important inflation report will be released, which may indicate a slowdown to 8.2–8.3% y/y. Core inflation may remain at 7.1% year over year. With such consumer price index values, the Bank of England has no choice but to raise the interest rate, which currently stands at 5%. Perhaps partly for this reason, the British currency is growing, as no other reasons can be devised now. The question is how much more the Bank of England will tighten monetary policy. It should be noted that the market started getting rid of the dollar as soon as American inflation began to decline. In other words, traders have already priced practically all future rate hikes. When will we witness something similar regarding the pound?
On Friday, a non-major report on retail sales will be published in the UK, which may have a localized impact on the pair's movement. Most likely, its significance will be neutral.
In the United States, several minor publications are expected. On Tuesday, there will be retail sales and industrial production reports. On Wednesday, building permits will be announced. On Thursday, unemployment claims will be released. It is unlikely that any of these reports will trigger significant dollar growth. The dollar can show growth only when the market decides to stop buying the pair and start booking profits. Only the market knows when that will happen. Therefore, we need to continue monitoring technical changes on the charts to be prepared for a possible downturn. It can start unexpectedly, just like the rise did this week.

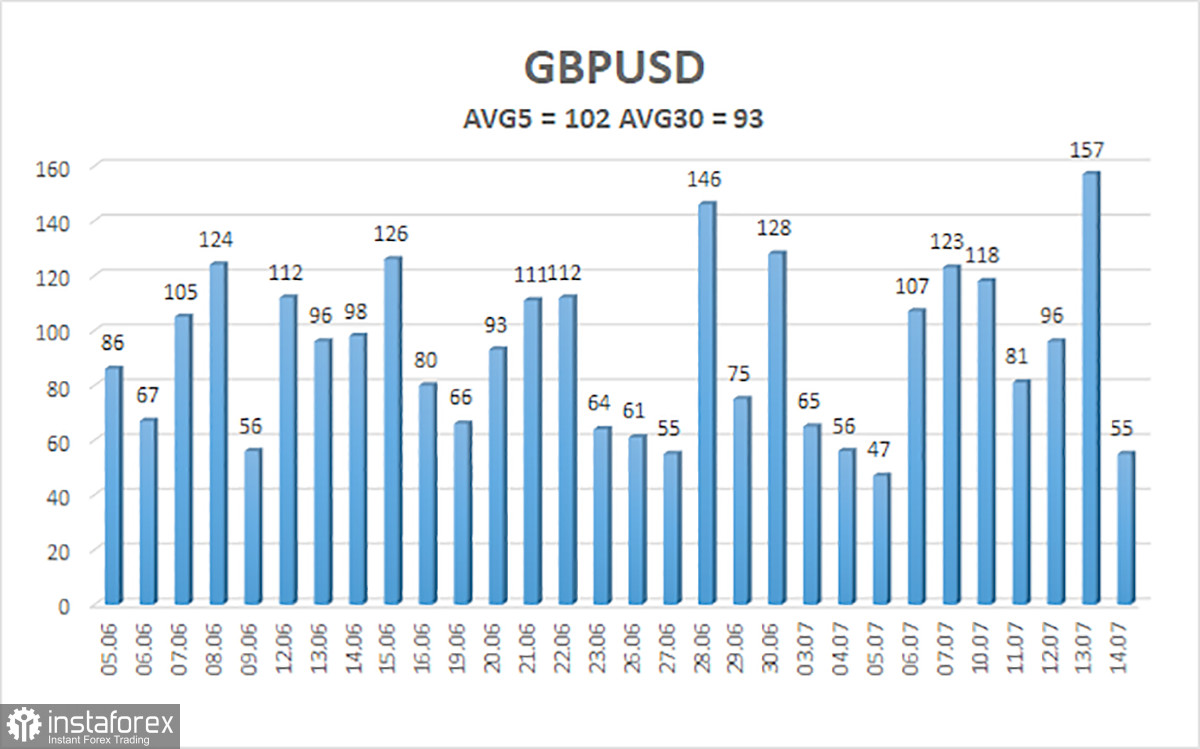
The average volatility of the GBP/USD pair over the last five trading days is 102 pips, categorized as "average." Therefore, on Monday, July 17, we expect movement between 1.2986 and 1.3190. A reversal of the Heiken Ashi indicator upwards will signal a resumption of the upward trend.
Nearest support levels:
S1 - 1.3062
S2 - 1.3000
S3 - 1.2939
Nearest resistance levels:
R1 - 1.3123
R2 - 1.3184
R3 - 1.3245
Trading recommendations:
In the 4-hour timeframe, the GBP/USD pair attempts to start a downward correction. At the moment, long positions remain relevant with targets at 1.3184 and 1.3245, which should be opened in case of a reversal of the Heiken Ashi indicator upwards. Short positions can be considered if the price consolidates below the moving average with targets at 1.2878 and 1.2817.
Explanations for the illustrations:
Linear regression channels - help determine the current trend. If both channels are moving in the same direction, it indicates a strong trend.
Moving average line (settings 20.0, smoothed) - determines the short-term trend and the direction for trading.
Murray levels - target levels for movements and corrections.
Volatility levels (red lines) - the probable price channel the pair is expected to trade in the next few days, based on current volatility indicators.
CCI indicator - its entry into the oversold zone (below -250) or overbought zone (above +250) indicates an upcoming trend reversal in the opposite direction.
 English
 Русский
 Bahasa Indonesia
 Bahasa Malay
 ไทย
ไทย Español
 Deutsch
 Български
 Français
 Tiếng Việt
 中文
中文 বাংলা
বাংলা हिन्दी
 Čeština
 Українська
 Română

