Long-term perspective.

The GBP/USD pair increased by 260 points throughout the current week. In our previous article concerning the EUR/USD pair, we questioned the rationale behind the European currency's rise, as the sole significant report of the week pertained to US inflation. At the same time, the dollar fell 4 out of the 5 days. The situation with the pound appears even more puzzling and paradoxical. Even when disregarding the infamous inflation report, there were ample statistics from the UK this week. Most of it, however, proved detrimental to the British currency and its economy. Despite this, the pound only acknowledged this unfortunate reality and sustained its upward movement on Friday. The pair stayed in the same position throughout the day.
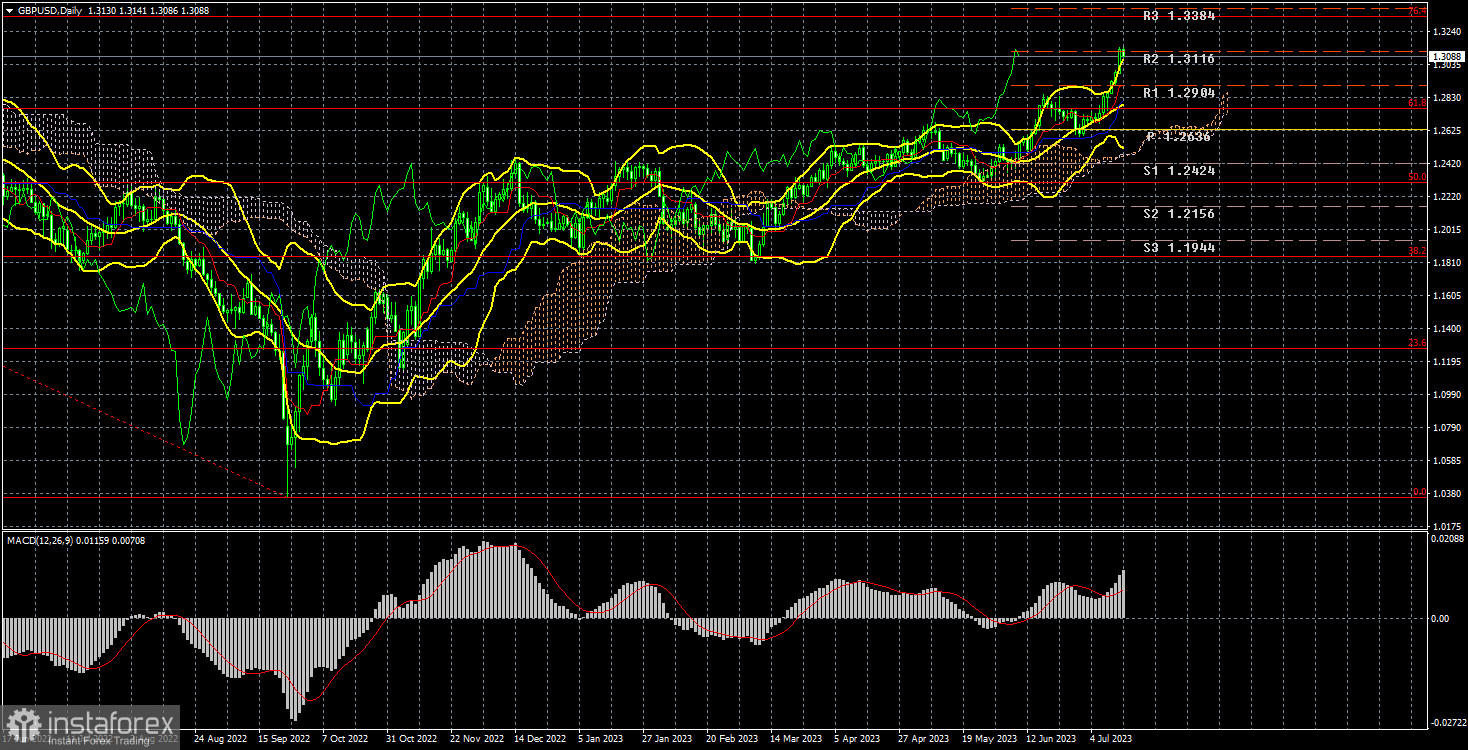
Therefore, the situation with the pound, having already seen a rise of 2800 points over the past 10 months, is even more paradoxical than that of the euro. Indeed, the Bank of England continues its monetary policy tightening, but so has the US for the last 10 months. The geopolitical conflict in Europe, which could have driven dollar growth last year, persists. The macroeconomic statistics from across the Atlantic are stronger than those from the UK. The labor market and economy are considerably stronger in the US than in the UK. Yet, as clearly demonstrated in the accompanying illustration, the pound continues to rise as if being spurred on and hasn't even been able to make a proper correction.
Thus, from a technical standpoint, everything is excellent. Traders have a strong upward trend at their disposal. A trend, after all, is always preferable to a flat market. There's only reason to rejoice and profit each day. But in this scenario, one must completely disregard the fundamentals and macroeconomics, which currently do not influence the market mood.
COT Analysis.

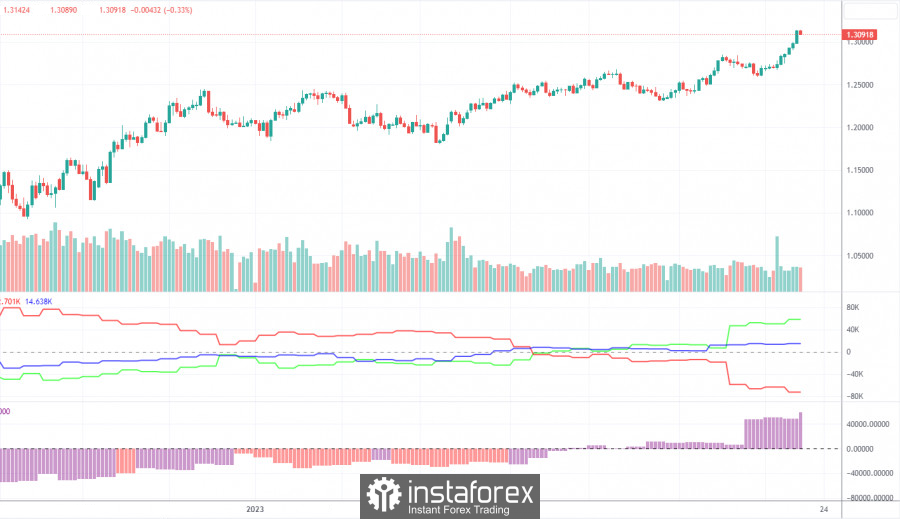
According to the most recent report concerning the British pound, the "Non-commercial" group opened 15.2 thousand buy contracts and 7.4 thousand sell contracts. Consequently, the net position of non-commercial traders rose by 7.8 thousand contracts during the week and continues to rise overall. The net position indicator has been consistently increasing over the past 10 months, and so has the British pound. We are now nearing a point where the net position has grown excessively, making it hard to anticipate the continuation of the pair's rise. The pound should now be entering a prolonged and drawn-out decline phase. While COT reports allow for a slight further strengthening of the British currency, belief in this is diminishing daily. As to what might cause the market to continue buying, it's hard to determine. Furthermore, there aren't any technical sell signals at present.
The British currency has already appreciated by a significant 2800 points. Without a strong downward correction, any additional growth would seem completely irrational. Despite this, there has been no logical pattern to the currency pair's movements for quite some time. The "Non-commercial" group currently holds 111.6 thousand contracts for purchase and 53.6 thousand for sale. Despite the ongoing growth, we are still skeptical about the long-term prospects of the British currency. The market continues its buying trend, and as a result, the currency pair continues its upward movement, reminiscent of Bitcoin's movements.
Analysis of Fundamental Events:
This week, the UK experienced only a few major macroeconomic events. Despite that, there was a good number of reports. The unemployment rate has risen more than expected, with unemployment benefit claims surpassing predictions by 48 thousand. The GDP shrank by 0.1% in May, and industrial production fell by 0.6%. It is challenging to explain how the pound increased by nearly 300 points amidst such statistics. Powerful speeches from Andrew Bailey, and Jerome Powell, or significant global news, could have justified such movements. However, none of these occurred. We have previously commented on the unjustifiable rise of the pound, but it has now reached its peak. After a significant surge this week, the price could not initiate a correction on Friday. This suggests that the British currency could continue to rise in the coming week, regardless of the macroeconomic and fundamental backdrop.
Trading plan for July 17-21:
Once again, the pound/dollar pair attempted to initiate a correction, but it failed to stabilize below the critical level. Each subsequent correction attempt appears increasingly feeble. The price is currently above all the lines of the Ichimoku indicator, indicating that long positions could technically be considered. Growth could be chaotic, weak, inert, or inexplicable. The target is the 76.4% Fibonacci level of 1.3330.
On the other hand, there is currently no technical justification for selling. At the very least, we would need to see a consolidation below the Kijun-sen line, which seems unlikely in the near term. Selling in such a strong upward trend is risky and arguably foolish, as is buying without a clear understanding of why the pound appreciates and when this trend may end. The situation is unconventional and arguably at an impasse. On the 4-hour TF, purchases could be considered when the price is above the moving average.
Explanation for the illustrations:
Support and resistance price levels and Fibonacci levels serve as targets when initiating purchases or sales. Take Profit levels can be set around these.
The Ichimoku indicators (standard settings), Bollinger Bands (standard settings), and MACD (5, 34, 5) are all used.
Indicator 1 on the COT charts represents the net position size for each trader category.
Indicator 2 on the COT charts indicates the net position size for the "Non-commercial" group.
 English
 Русский
 Bahasa Indonesia
 Bahasa Malay
 ไทย
ไทย Español
 Deutsch
 Български
 Français
 Tiếng Việt
 中文
中文 বাংলা
বাংলা हिन्दी
 Čeština
 Українська
 Română

