Details of the economic calendar on July 13
The UK Industrial production data dropped from -1.6% to -2.3%, which is slightly better than the forecast of -2.4%. A similar indicator was published in the EU, where a 0.2% increase in industrial production was replaced by a -2.2% decline. Despite being a negative factor for the economy, the euro reacted inversely.
During the American trading session, the Producer Price Index was published in the United States, which increased by 0.1% annually in June, against the expected 0.4%. The U.S. dollar remained under "bearish" pressure after the data was released.
Analysis of trading charts from July 13
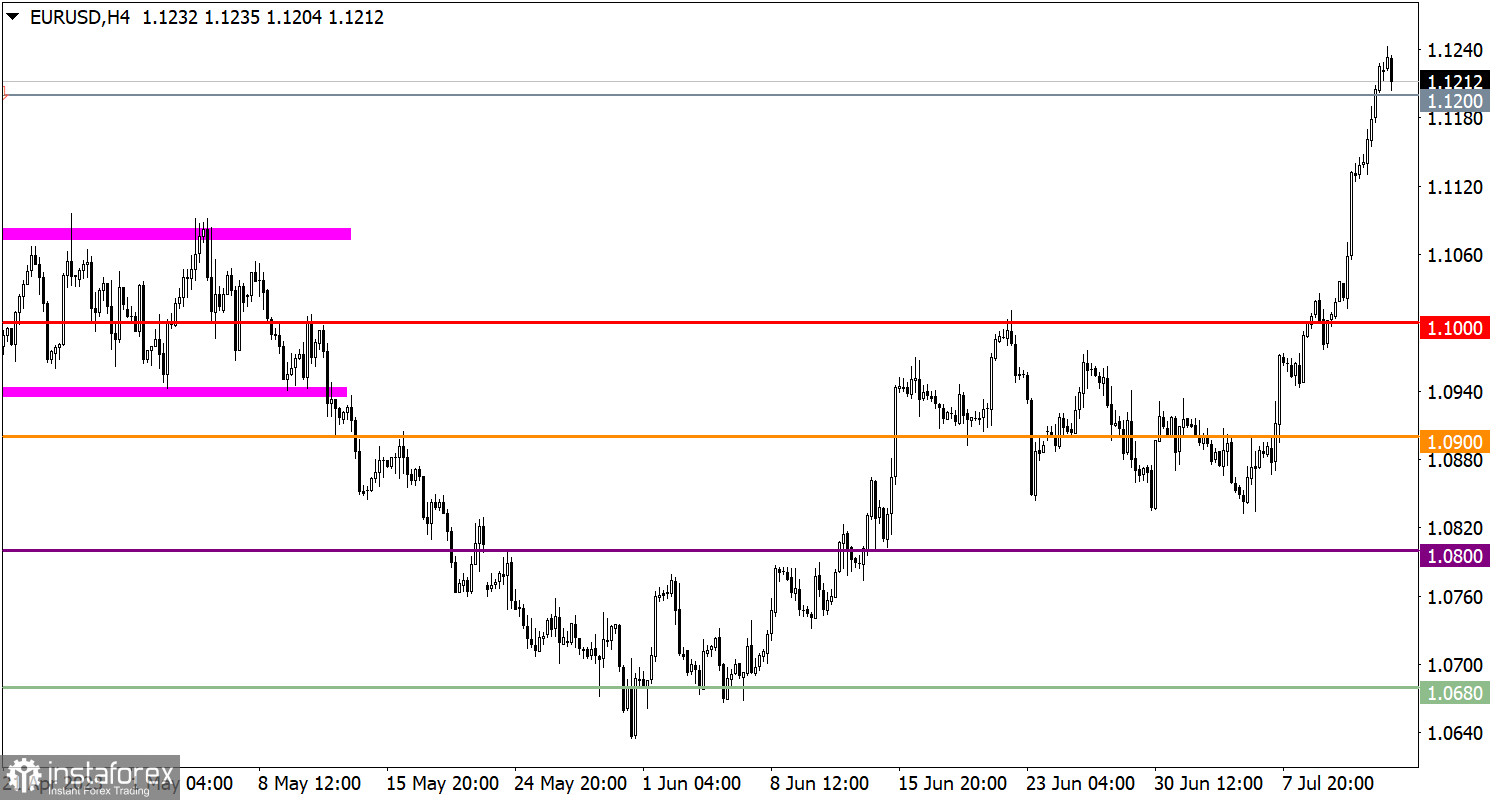
EUR/USD strengthened by about 300 points from the start of the trading week as part of an inertial movement. This significant price change over a short period indicates an overheating of long positions in the market.
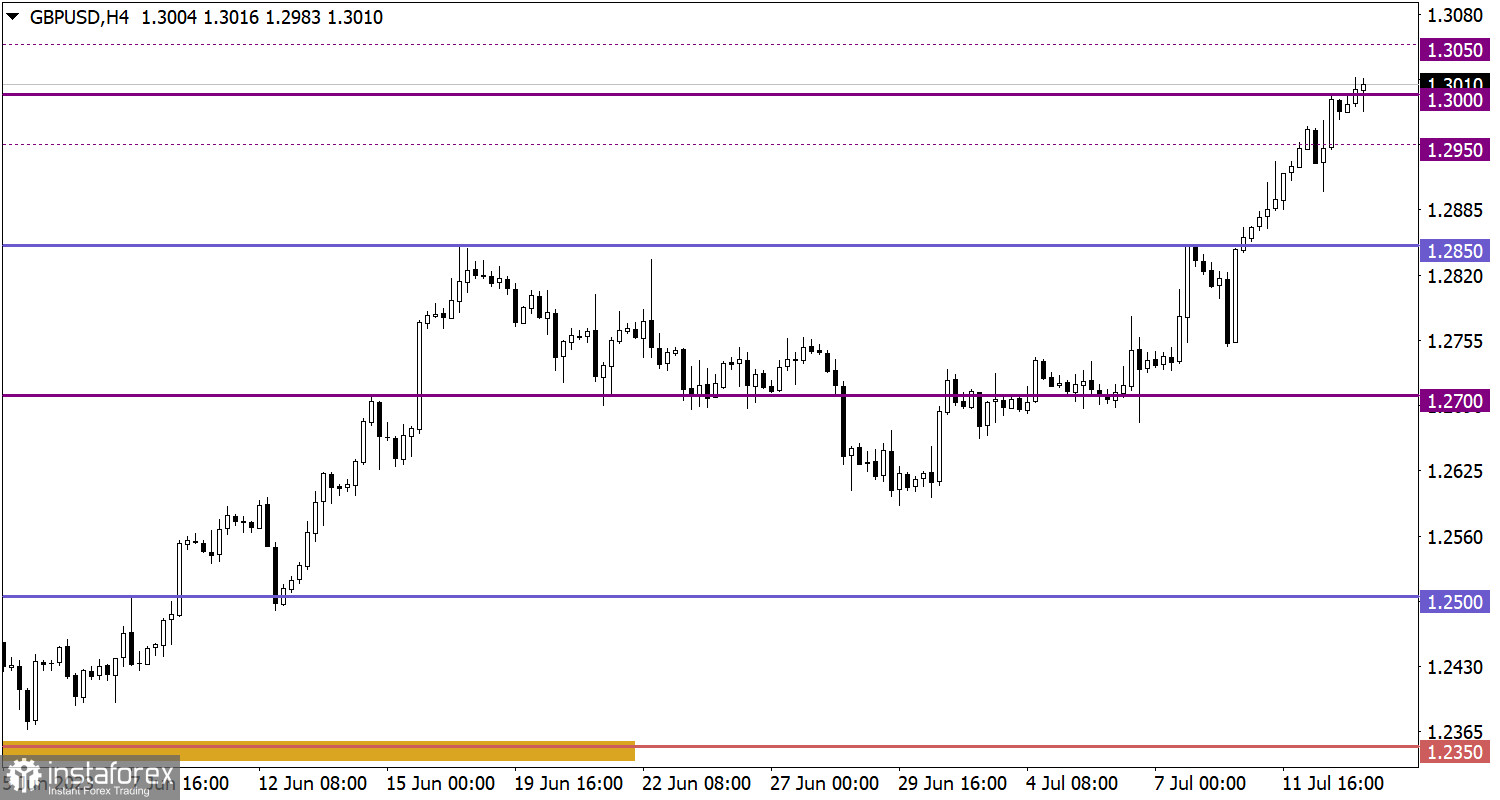
GBP/USD strengthened by about 350 points from the start of the trading week. This strong price change has led to the emergence of inertial-speculative movement in the market.

Economic calendar for July 14
Today, the macroeconomic calendar is empty. No publication of important statistical data is expected in the European Union, the United Kingdom, and the United States.
In this regard, investors and traders intend to focus on the incoming information and news flow.
EUR/USD trading plan for July 14
In this situation, a pullback would be a logical step, however, speculative hype can completely ignore the signals from technical analysis. In this case, the inertial movement will continue to form, leading to an even stronger overheating of long positions on the euro.

GBP/USD trading plan for July 14
From a technical analysis perspective, a reduction in the volume of long positions may occur due to the overbought pound sterling. As a result, a pullback or stagnation may occur in the market. However, speculators have the right to ignore any technical signals, so there is a possibility of continued growth of the pound sterling towards the 1.3300 level.

What's on the charts
The candlestick chart type is white and black graphic rectangles with lines above and below. With a detailed analysis of each individual candle, you can see its characteristics relative to a particular time frame: opening price, closing price, intraday high and low.
Horizontal levels are price coordinates, relative to which a price may stop or reverse its trajectory. In the market, these levels are called support and resistance.
Circles and rectangles are highlighted examples where the price reversed in history. This color highlighting indicates horizontal lines that may put pressure on the asset's price in the future.
The up/down arrows are landmarks of the possible price direction in the future.
 English
 Русский
 Bahasa Indonesia
 Bahasa Malay
 ไทย
ไทย Español
 Deutsch
 Български
 Français
 Tiếng Việt
 中文
中文 বাংলা
বাংলা हिन्दी
 Čeština
 Українська
 Română

