 English
  Русский
 Bahasa Indonesia
 Bahasa Malay
 ไทย
ไทย Español
 Deutsch
 Български
 Français
 Tiếng Việt
 中文
中文 বাংলা
বাংলা हिन्दी
 Čeština
 Українська
 Română

Trend analysis (Fig. 1)
On Friday, the price may go down from 1.3131 (the close price of yesterday's daily candlestick) to the 14.5% retracement level of 1.3059 (blue dotted line). Once the price reaches this level, growth may extend.
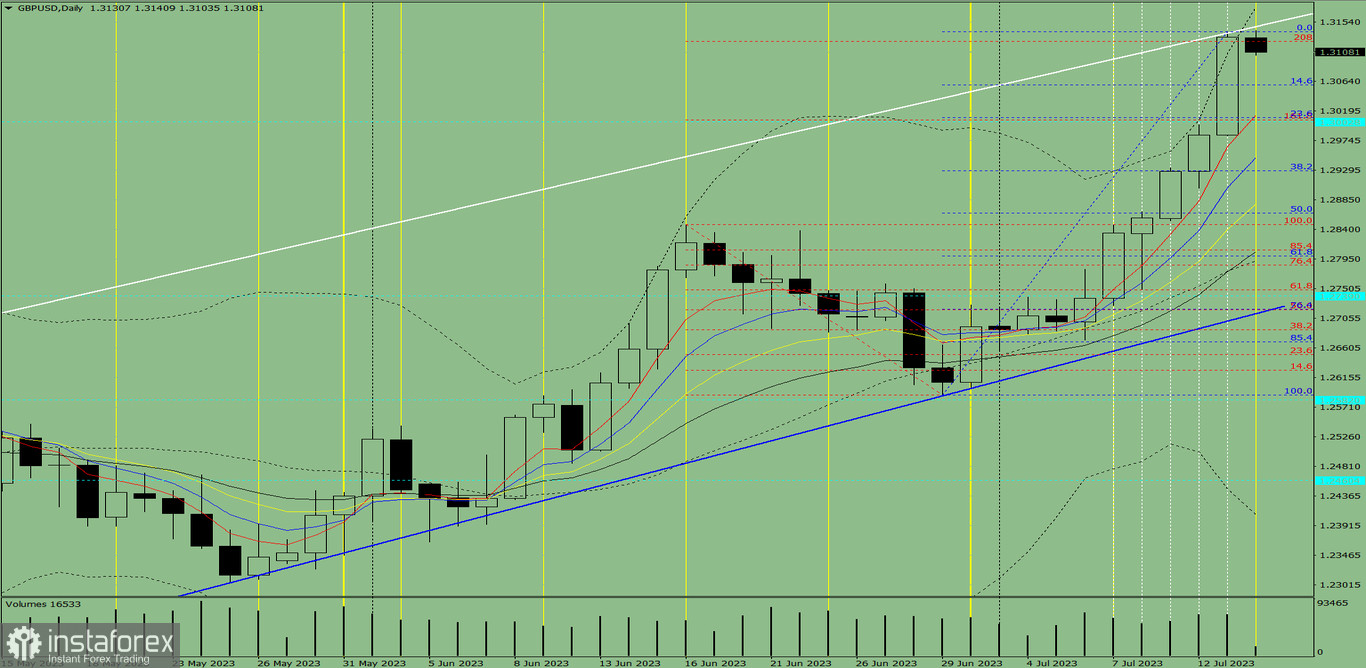
Fig. 1 (daily chart)
Complex analysis:
- indicator analysis - down
- Fibonacci levels - down
- volumes - down
- candlestick analysis - down
- trend analysis - up
- Bollinger bands - up
- weekly chart - up
Conclusion:
Today, the price may go down from 1.3131 (the close price of yesterday's daily candlestick) to the 14.5% retracement level of 1.3059 (blue dotted line). Once the price reaches this level, growth may extend.
Alternative scenario: the price may go down from 1.3131 (the close price of yesterday's daily candlestick) to the 23.6% retracement level of 1.3009 (blue dotted line). Once the price reaches this level, growth may extend.