 English
  Русский
 Bahasa Indonesia
 Bahasa Malay
 ไทย
ไทย Español
 Deutsch
 Български
 Français
 Tiếng Việt
 中文
中文 বাংলা
বাংলা हिन्दी
 Čeština
 Українська
 Română

5M chart of EUR/USD
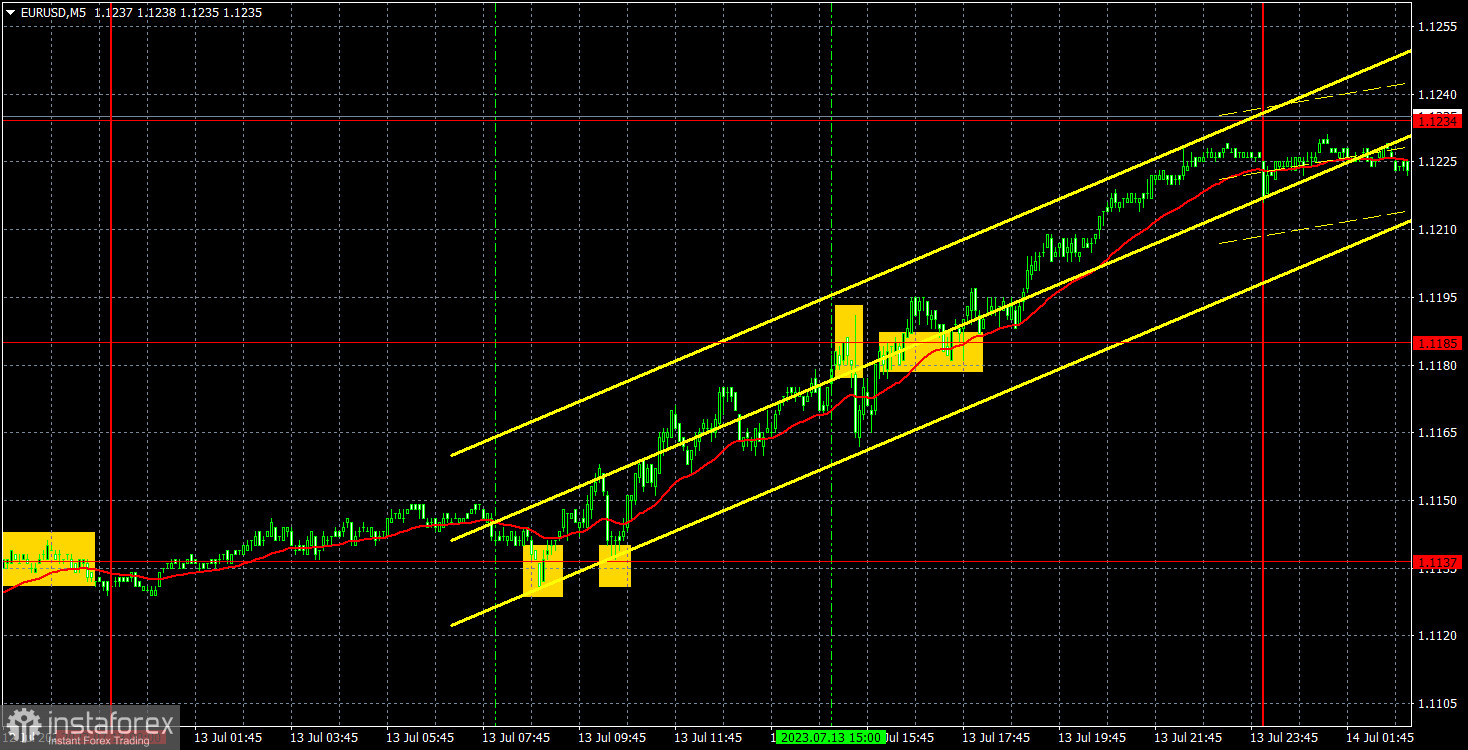
The EUR/USD pair rose on Thursday, refusing to slow down. The euro showed more growth, even without a prior correction, although on Monday, Tuesday, and Wednesday the pair also grew significantly. Should we mention that in half of the cases, the market didn't even have formal reasons to buy the pair? Yesterday was a perfect example of this. The EU industrial production report turned out to be weaker than forecasts, which is no longer surprising anyone. The two US reports turned out to be neutral (one slightly better than forecasts, the other slightly worse). In both cases, the dollar managed to rise by 20 pips and then continued to fall calmly. Thus, the euro is growing now regardless of reports and events. It grows because the market buys, a typical "bitcoin move".
However, good signals are formed on such a pullback-free movement. Two buy signals materialized around the 1.1137 level in yesterday's European trading session. This should have been executed using a long position. The pair bounced around the level of 1.1185 (quite unsuccessful at that) and a sell signal was made. Therefore, longs should have been closed at a profit of around 20 points, but shorts should not have been opened, as the signal itself was strange. At the time of its formation, the pair had retreated from the high by 25 points, and it was difficult to expect a strong drop in a firm uptrend. Therefore, it was better to work out the next buy signal in the form of a breakthrough of the 1.1185 mark, which brought another 20-30 pips of profit.
COT report:
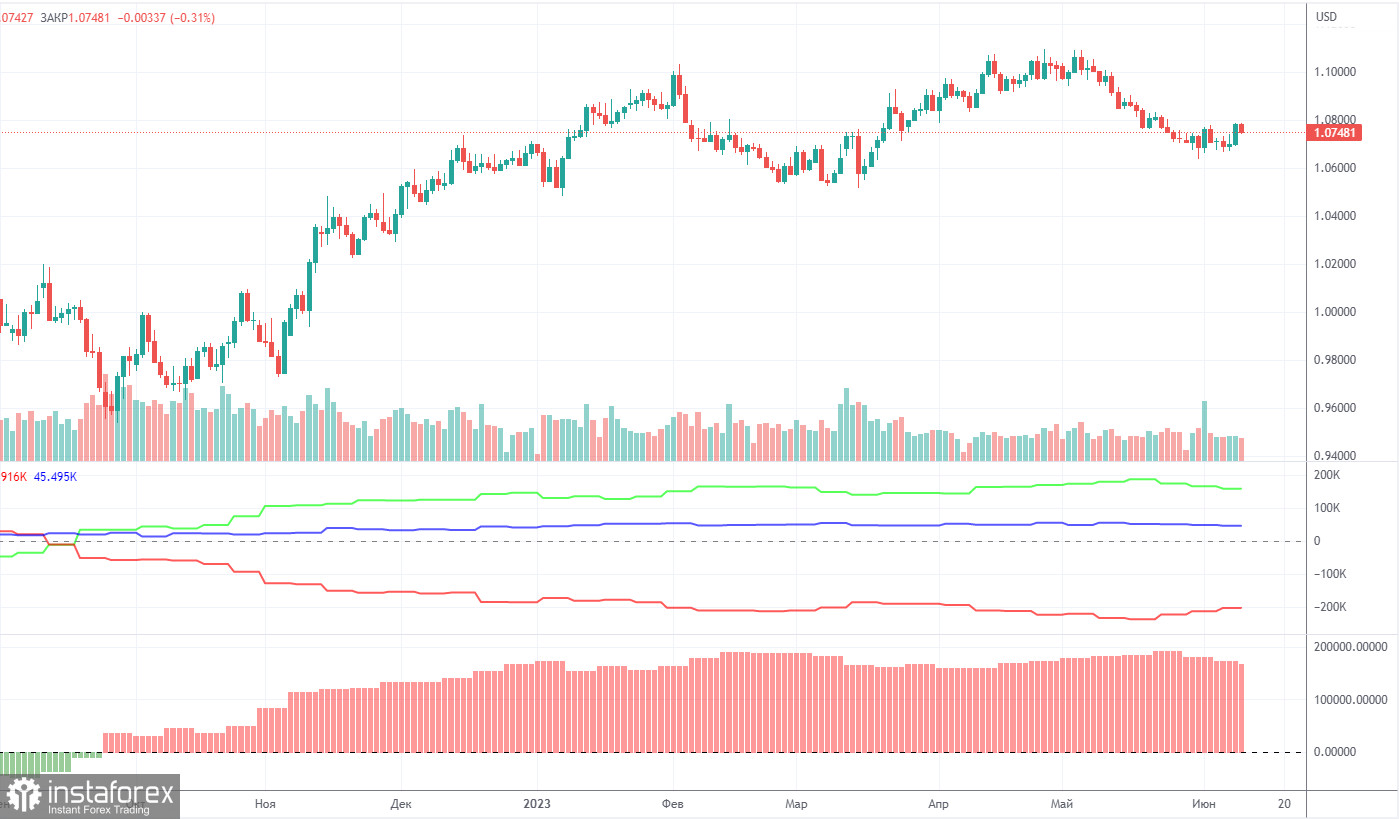
On Friday, the new COT report for July 3 was released. Over the past 10 months, COT data has been in line with developments in the market. The net position of large traders (the second indicator on the chart) has been on the rise since September 2022. The euro started to show strength approximately at the same time. For the last 5 months, the net position is no longer growing, and the euro is not rising either. Currently, the net non-commercial position is bullish and keeps growing further. Meanwhile, the euro is still strong against the dollar.
We have repeatedly pointed out that a relatively high value of the net position suggests a potential end of the uptrend. This is shown by the first indicator, where the red and green lines have significantly diverged, which often precedes a trend reversal.
During the last reporting week, the number of long positions held by non-commercial traders decreased by 2,700 while the number of short positions fell by 500. As a result, the net position dropped by 2,200, which is very small. The number of long positions still exceeds the number of short ones by 143,000, an almost threefold gap. In principle, even without the COT reports, it's clear that the euro should fall, but the market is in no hurry to sell. Perhaps it fears a stronger increase in the ECB rate.
1H chart of EUR/USD
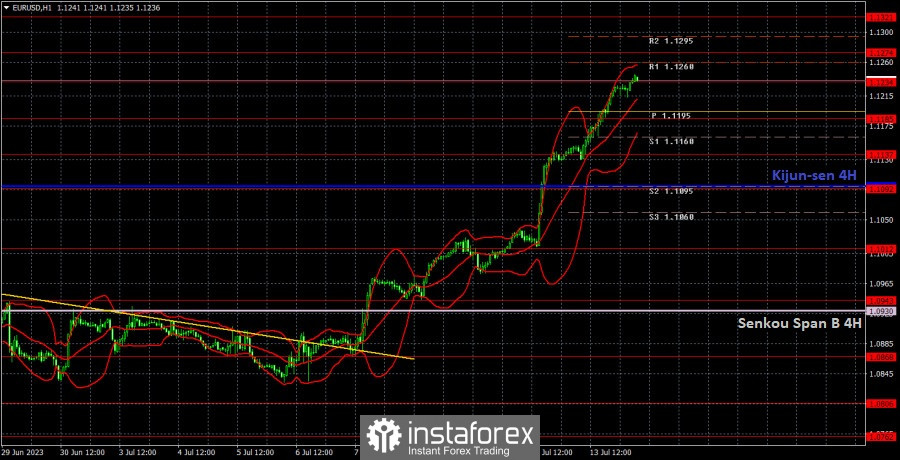
In the 1-hour chart, the pair extends its upward movement. If the euro had a reason to rise on Wednesday, and it was a stretch last Friday, then why did the dollar fall on Monday, Tuesday and Thursday? It remains a mystery. We believe that the market has started a new stage of the USD sell-off, and its mood is only slightly affected by fundamentals and economic factors.
On July 14, trading levels are seen at 1.0762, 1.0806, 1.0868, 1.0943, 1.1012, 1.1092, 1.1137, 1.1185, 1.1234, 1.1274, 1.1323, as well as Senkou Span B (1.0930) and Kijun-sen (1.1095) lines. Ichimoku indicator lines can move intraday, which should be taken into account when determining trading signals. There are also support and resistance although no signals are generated near these levels. Signals could be made when the price either breaks or bounces from these extreme levels. Do not forget to place a Stop Loss at the breakeven point when the price goes by 15 pips in the right direction. In case of a false breakout, it could save you from possible losses.
There are no important events or reports lined up for the European Union. There is only a minor report on the US consumer sentiment index, which is unlikely to provoke a strong reaction, and even less likely to help the dollar rise.
Indicators on charts:
Resistance/support - thick red lines, near which the trend may stop. They do not make trading signals.
Kijun-sen and Senkou Span B are the Ichimoku indicator lines moved to the hourly timeframe from the 4-hour timeframe. They are also strong lines.
Extreme levels are thin red lines, from which the price used to bounce earlier. They can produce trading signals.
Yellow lines are trend lines, trend channels, and other technical patterns.
Indicator 1 on the COT chart is the size of the net position of each trader category.
Indicator 2 on the COT chart is the size of the net position for the Non-commercial group of traders.