 English
  Русский
 Bahasa Indonesia
 Bahasa Malay
 ไทย
ไทย Español
 Deutsch
 Български
 Français
 Tiếng Việt
 中文
中文 বাংলা
বাংলা हिन्दी
 Čeština
 Українська
 Română

The growth and a false breakout of 1.2911 gave an excellent entry point into short positions, which led to a drop of more than 40 pips. In the afternoon, the pound sterling continued to rise but there were no entry points.
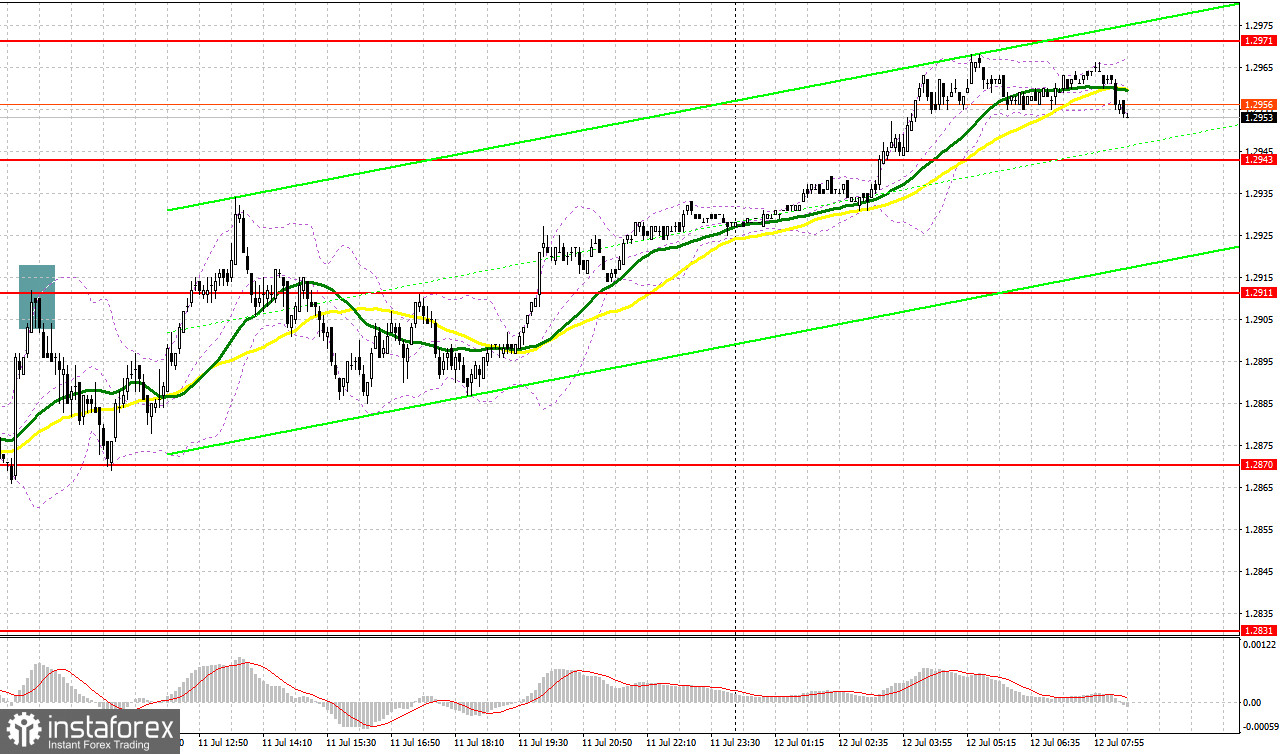
When to open long positions on GBP/USD:
The pound sterling maintained upward movement amid upbeat data on the average hourly wages in the UK. Even a slight increase in the unemployment level did not undermine its rise. Today, BoE Governor Andrew Bailey will certainly comment on yesterday's data during his speech, which could fuel demand for the pound sterling. The Bank of England's financial stability report and the meeting minutes will be unveiled as well. However, given the reports that will be released in the afternoon, I would advise you not to rush to open long positions at the current highs.
One should go long on the decline from the support level of 1.2927, formed yesterday. A false breakout will indicate the presence of large buyers in the market. It could trigger a buy signal. GBP/USD may climb to the resistance level of 1.2966 where trading is currently carried out. A breakout and consolidation above this level will provide an additional buy signal with a rise to 1.3007. A more distant target will be the 1.3046 level where I recommend locking in profits. If the pair declines to 1.2927 and bulls show no activity at this level, the pair will hardly be able to grow higher. In this case, only the protection of 1.2887 where the moving averages are passing, as well as a false breakout will create new entry points into long positions. You could buy GBP/USD at a bounce from 1.2845, keeping in mind an upward intraday correction of 30-35 pips.
When to open short positions on GBP/USD:
The bears are unable to regain control. Until the moment when the pair hits its highs every day, it will be quite difficult for them to begin a downward correction. The main task for today will be the protection of the resistance level of 1.2966. They could also try to return the pair to the support level of 1.2927. If the pair grows, a false breakout of 1.2966 will give an excellent sell signal, which could increase pressure on GBP/USD before the release of important US reports. The pair may tumble to the support level of 1.2927. A breakout and an upward retest will undermine bullish sentiment, pushing GBP/USD to 1.2887. /a more distant target will be the low of 1.2845 where I recommend locking in profits.
If GBP/USD advances and bears fail to defend 1.2966, bulls will continue to control the market. In this case, I would advise you to postpone short positions until a test of the resistance level of 1.3007. A false breakout there will generate an entry point into short positions. If there is no downward movement there, you could sell the pound sterling at a bounce from 1.3046, keeping in mind a downward intraday correction of 30-35 pips.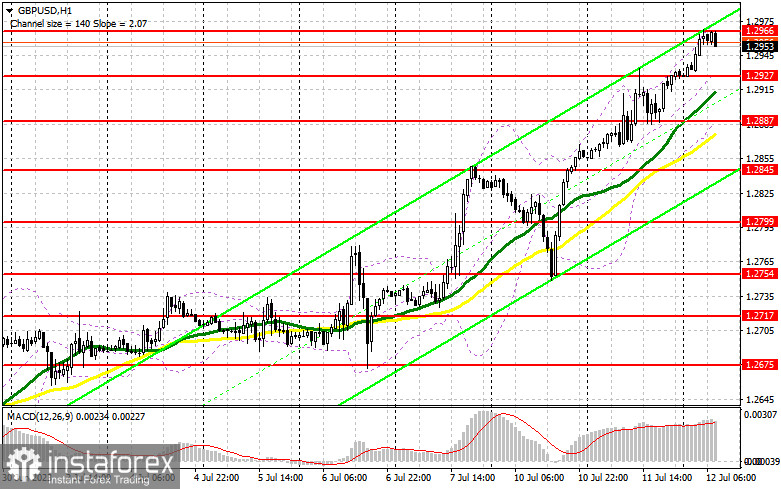 COT report
The COT report from July 3 logged a decrease in both long and short positions. Buyers will likely be aggressive due to the hawkish Bank of England. The regulator prefers to keep interest rates high despite all the pressure and economic issues because inflation remains persistent, affecting the welfare of households. No matter what the Fed's policymakers say, traders are now betting on a weaker US dollar in the medium term. This is due to the nearly-peaking interest rates in the US. Therefore, buying the pound during falls remains an optimal trading strategy. According to the latest COT report, short non-commercial positions dropped by 6.192 to 46,196, while long non-commercial positions fell by 7,921 to 96,461. The total non-commercial net position edged down to 50,265 versus 51,994 a week earlier. The weekly closing price declined to 1.2698 from 1.2735.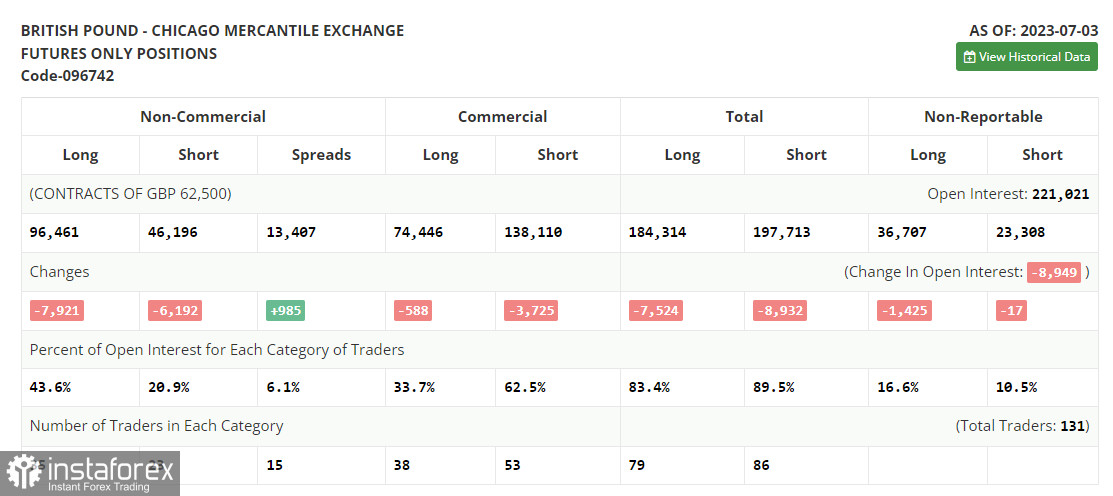 Indicator signals:
Moving averages:
Trading is carried out above the 30-day and 50-day moving averages, which indicates a further rise.
Note: The author considers the period and prices of moving averages on the H1 (1-hour) chart that differ from the general definition of the classic daily moving averages on the daily D1 chart.
Bollinger Bands
If GBP/USD declines, the indicator's lower border at 1.2887 will serve as support.
Indicator description:
- Moving average (MA) determines the current trend by smoothing volatility and noise. Period 50. Colored yellow on the chart.
- Moving average (MA) determines the current trend by smoothing volatility and noise. Period 30. Colored green on the chart.
- Moving Average Convergence/Divergence (MACD). Fast EMA 12. Slow EMA 26. SMA 9.
- Bollinger Bands. Period 20
- Non-commercial traders are speculators such as individual traders, hedge funds, and large institutions who use the futures market for speculative purposes and meet certain requirements.
- Long non-commercial positions are the total long position of non-commercial traders.
- Non-commercial short positions are the total short position of non-commercial traders.
- Total non-commercial net position is the difference between the short and long positions of non-commercial traders.