 English
  Русский
 Bahasa Indonesia
 Bahasa Malay
 ไทย
ไทย Español
 Deutsch
 Български
 Français
 Tiếng Việt
 中文
中文 বাংলা
বাংলা हिन्दी
 Čeština
 Українська
 Română

M5 chart of EUR/USD
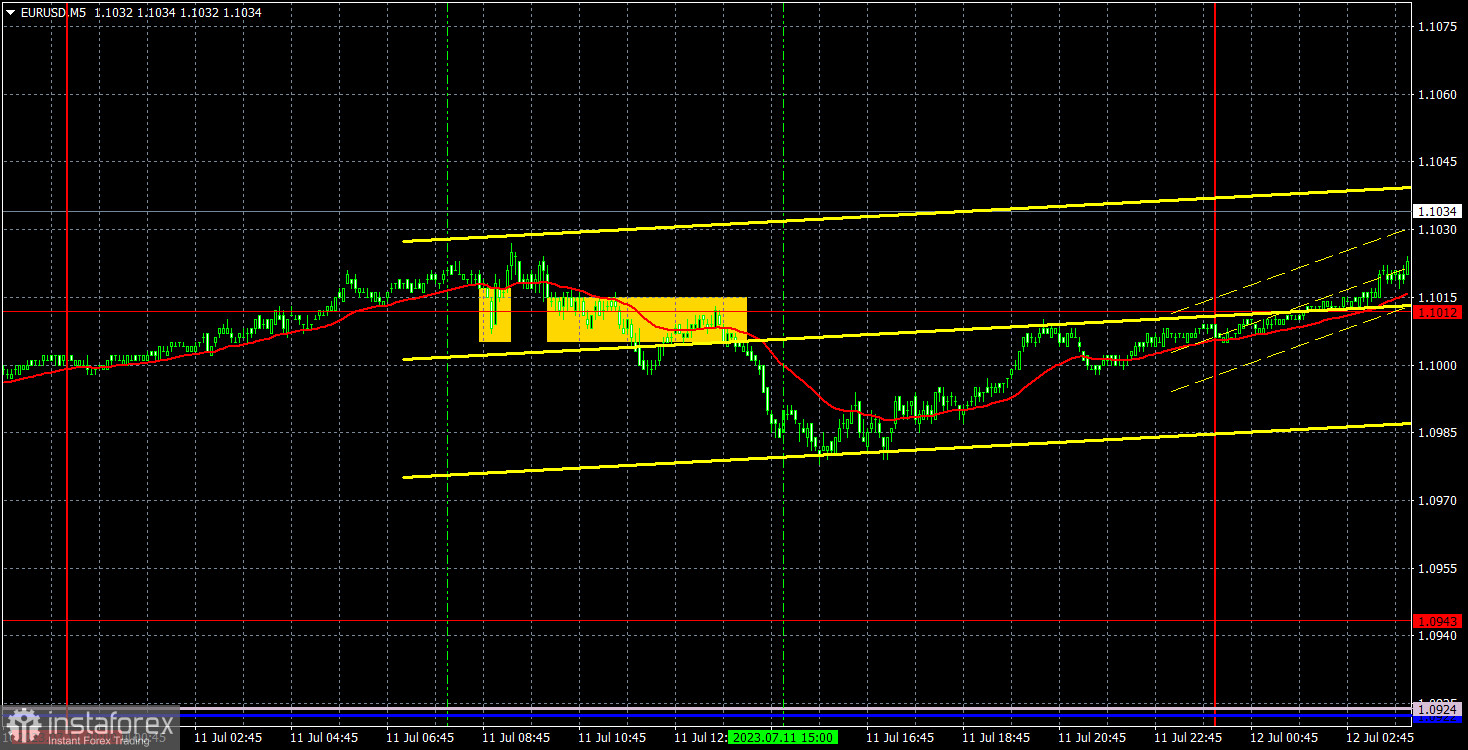
Moving up, EUR/USD showed relatively low volatility on Tuesday. Yesterday was quite uneventful in terms of macroeconomic events. In the morning, Germany say the release of final inflation data, which came in line with the initial estimate. However, that was not the cause of the euro's decline. Meanwhile, the ZEW economic sentiment index for Germany and the eurozone both came worse than forecast. As a result, the euro fell in the first half of the day. However, during the American trading session (when there were no events or reports at all), the dollar resumed its decline. The downtrend continued even during the Asian trading session overnight.
Only two trading signals were generated yesterday. Initially, the pair bounced off 1.1012, but it was only able to move up by a mere 5-10 pips, so it was not possible to set a stop-loss order for this trade. It closed with a small loss when a sell signal was formed around 1.1012. The pair then moved down by approximately 23 pips but returned to the level of 1.1012 by the evening, bringing a maximum profit of only 10 pips. As we can see, even good signals do not work properly when volatility is minimal.
COT report:
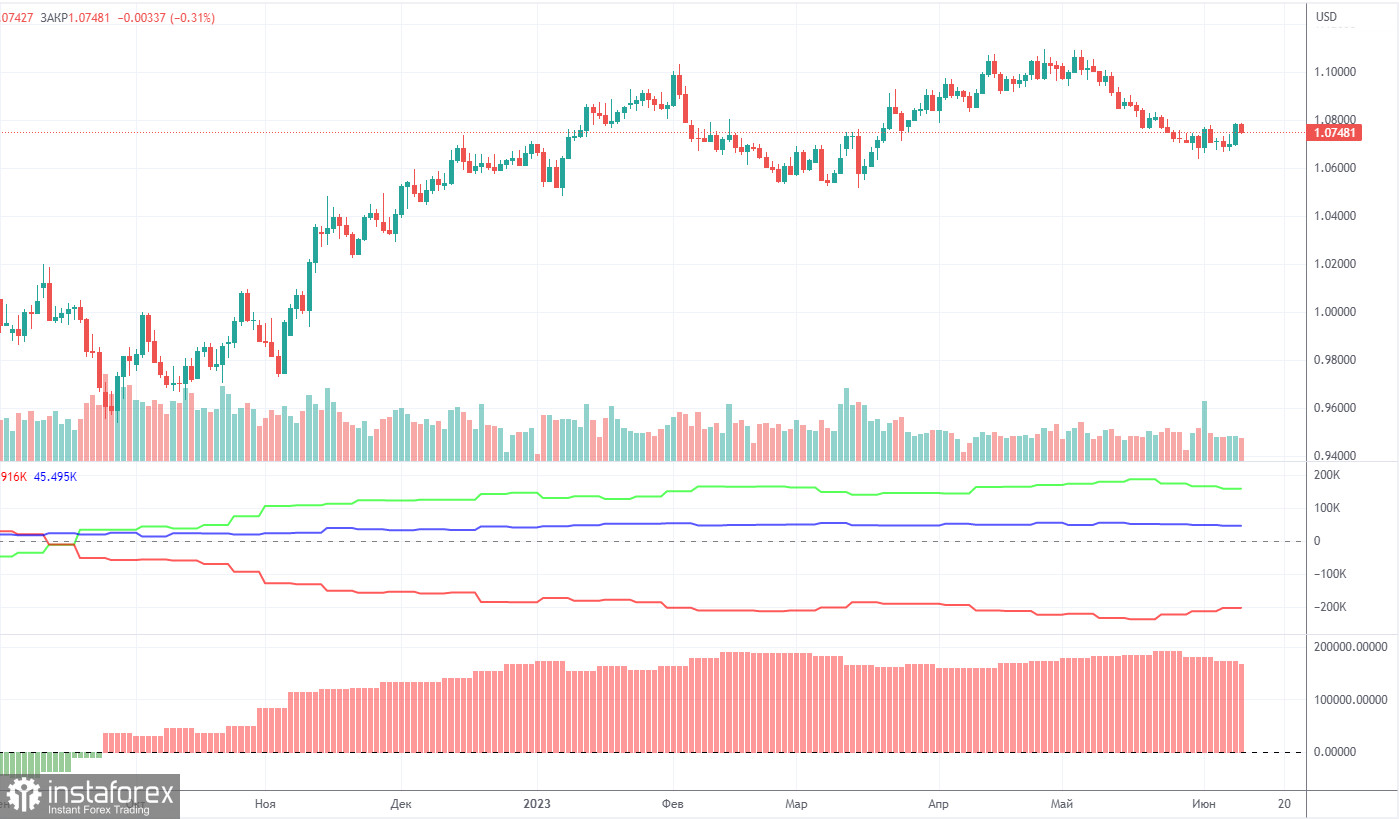
On Friday, a COT report for July 3 was delivered. Over the past 10 months, COT data has been in line with developments in the market. The net position of large traders (the second indicator on the chart) has been rising since September 2022. The euro started to show strength approximately at the same time. Over the last 5 months, the net position has no longer shown any growth as well as the euro. Currently, the net non-commercial position is bullish and keeps growing further. Meanwhile, the euro is still strong against the dollar.
We have repeatedly pinpointed that a relatively high value of the net position suggests a potential end of the uptrend. This is shown by the first indicator, where the red and green lines have significantly diverged, which often precedes a trend reversal.
During the last reporting week, the number of long positions held by non-commercial traders decreased by 2,700 while the number of short positions fell by 500. As a result, the net position dropped by 2,200, which is a very small decrease. The number of long positions still exceeds the number of short ones by 143,000, an almost threefold gap. All in all, even without COT reports, it is clear that the euro should go down, but the market is in no hurry to sell. Perhaps it fears a stronger increase in the ECB rate.
H1 chart of EUR/USD
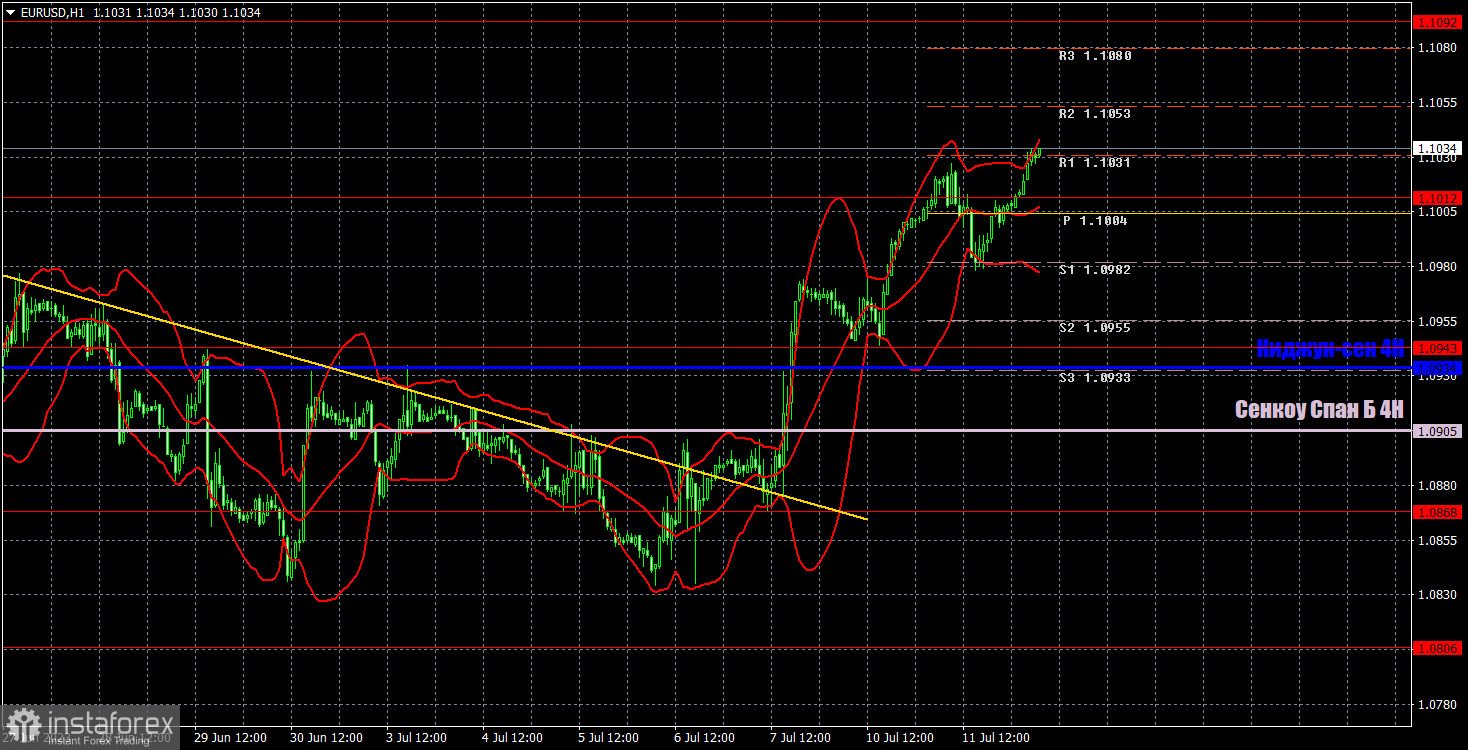
In the 1-hour chart, the pair broke through the descending trend line, breaking the downtrend. Currently, there are hardly any bullish factors for the euro. However, a US inflation report is due today, which is forecast to show a noticeable slowdown in figures. Therefore, we do not rule out the possibility that the market has already started to price in this report. This is the only explanation for the euro's growth on Monday and Tuesday.
On July 12, trading levels are seen at 1.0658-1.0669, 1.0762, 1.0806, 1.0868, 1.0943, 1.1012, 1.1092, 1.1137 as well as the Senkou Span B line (1.0905) and the Kijun-sen line (1.0934). Ichimoku indicator lines can move intraday, which should be taken into account when determining trading signals. There are also support and resistance although no signals are generated near these levels. Signals could be made when the price either breaks or bounces from these extreme levels. Do not forget to place a Stop Loss at the breakeven point when the price goes by 15 pips in the right direction. In case of a false breakout, it could save you from possible losses.
In the European Union, Philip Lane, the Chief Economist of the European Central Bank (ECB) will speak today. In the United States, the inflation report that has already triggered the dollar's decline this week will be published. Either the market has entered a new bullish phase on EUR/USD, or the attention has shifted to US inflation. Either way, all eyes will be on this report today.
Indicators on charts:
Resistance/support - thick red lines, near which the trend may stop. They do not make trading signals.
Kijun-sen and Senkou Span B are the Ichimoku indicator lines moved to the hourly timeframe from the 4-hour timeframe. They are also strong lines.
Extreme levels are thin red lines, from which the price used to bounce earlier. They can produce trading signals.
Yellow lines are trend lines, trend channels, and other technical patterns.
Indicator 1 on the COT chart is the size of the net position of each trader category.
Indicator 2 on the COT chart is the size of the net position for the Non-commercial group of traders.