 English
  Русский
 Bahasa Indonesia
 Bahasa Malay
 ไทย
ไทย Español
 Deutsch
 Български
 Français
 Tiếng Việt
 中文
中文 বাংলা
বাংলা हिन्दी
 Čeština
 Українська
 Română

Analyzing Tuesday's trades:
GBP/USD on 30M chart
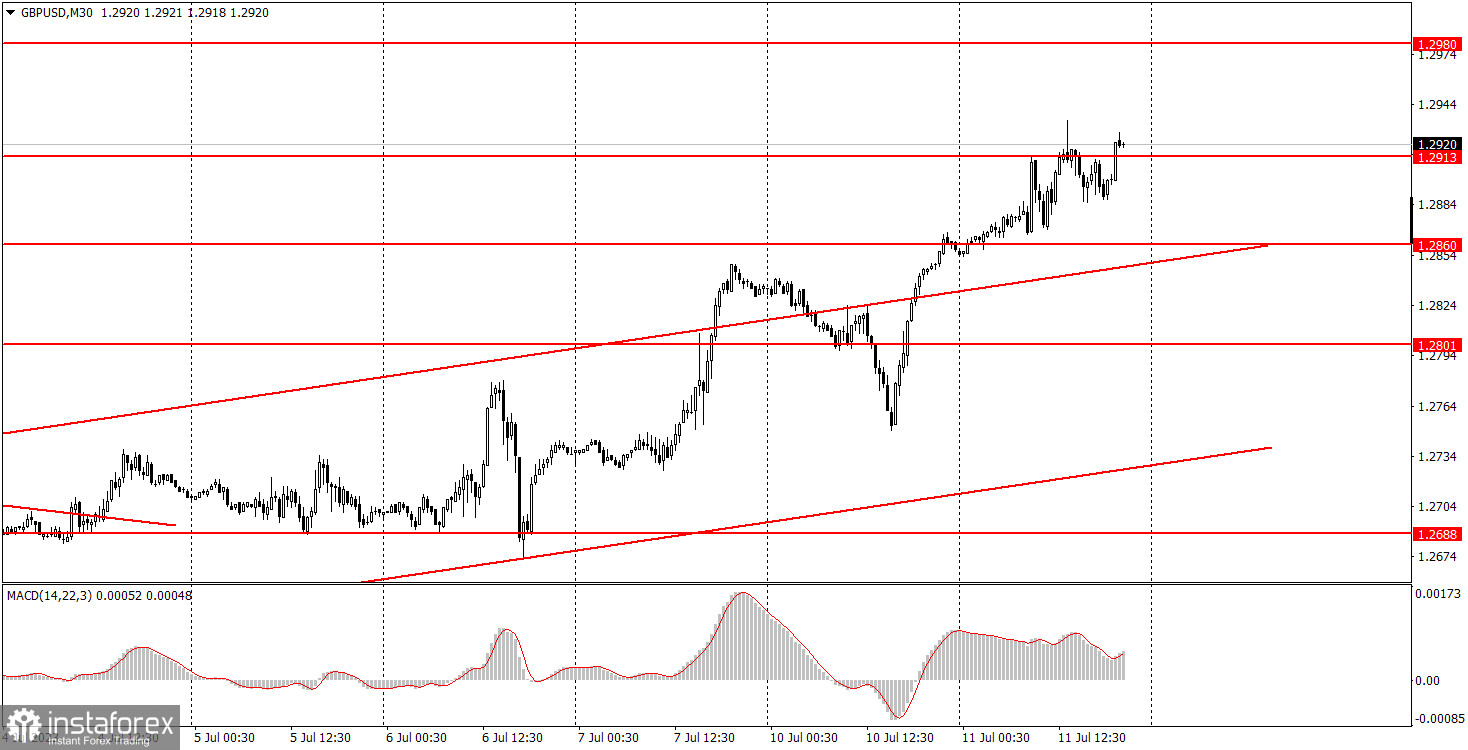
On Tuesday, the GBP/USD pair managed to "fly" both up and down again, but with less volatility. Despite the fact that three important UK reports were released on Tuesday morning, at least two of which were not in favor of the British currency, the pound still managed to appreciate by the end of the day. And that's all you need to know about the logic of movements at that moment. The unemployment rate in the UK has risen and risen more than forecasts. The number of unemployment benefit claims exceeded forecasts by 48,000. Average earnings almost coincided with forecasts in terms of their growth. Two reports that were definitely negative for the pound, but the pound is still rising. Moreover, there were no important events in the US that could theoretically provoke the dollar's fall.
Thus, the uptrend persists, and the pound continues to rise. Such a movement can continue as long as it wants, because it is not based on either fundamental or macroeconomic background. The market just buys the pound and that's it. And it can do the same thing for a long time, although it is absolutely illogical.
GBP/USD on 5M chart
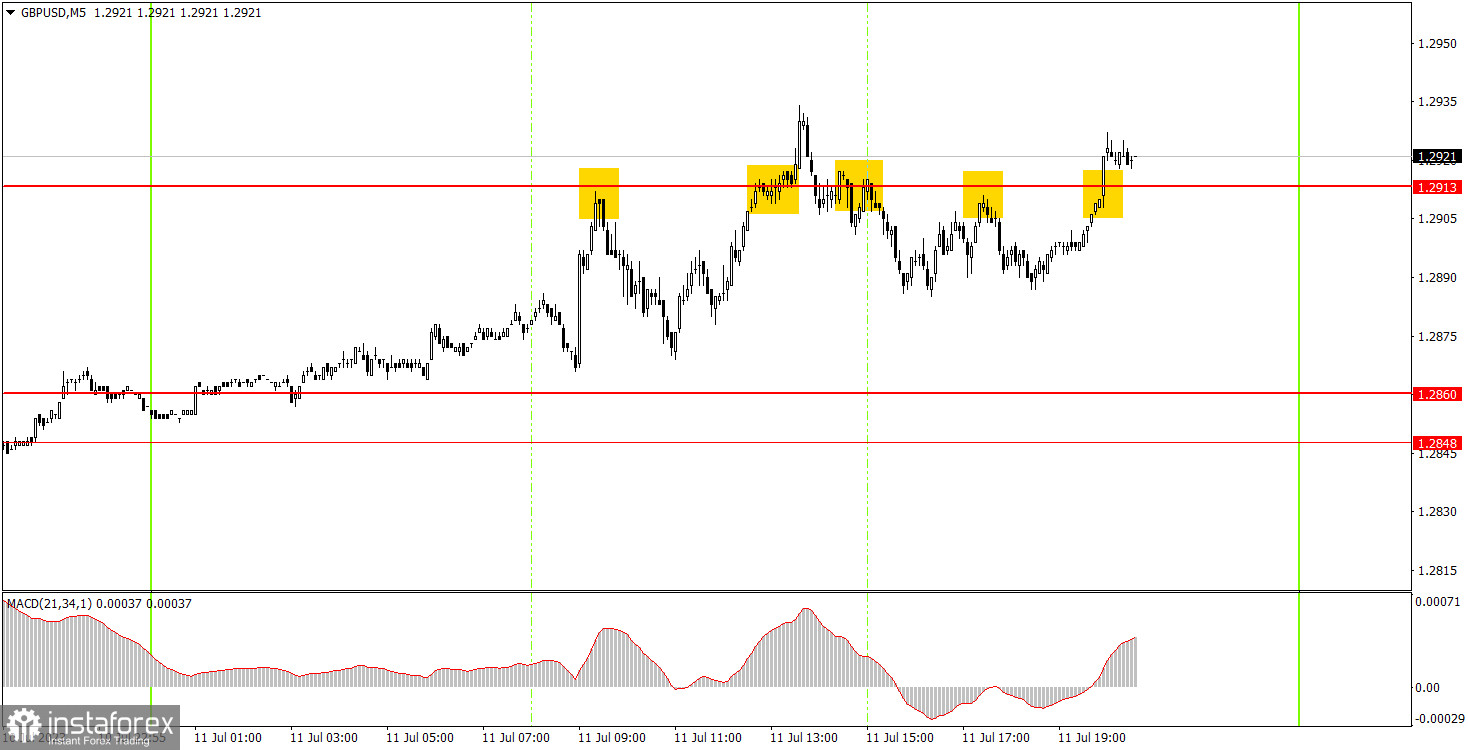
Five trading signals materialized on the 5M chart, all around the same level of 1.2913. The movement was not flat, but it was reminiscent of it. Volatility was low, and the pair constantly changed direction during the day. Therefore, traders could only try to work out the first two signals, which turned out to be false, and ignore the rest. In the first case, the Stop Loss order was triggered, as the price went down more than 20 points. In the second signal, it did not rise by 20 pips, so the trade closed at a small loss when the price dropped below 1.2913 again.
Trading tips on Wednesday:
As seen on the 30M chart, the GBP/USD pair continues to form a new uptrend. The pound can still rise even on those days when there is no fundamental background. Therefore, for purely technical reasons, GBP may extend its upward movement, but fundamental factors remain dubious. The key levels on the 5M chart are 1.2653, 1.2688, 1.2748, 1.2779-1.2801, 1.2848-1.2860, 1.2913, 1.2981-1.2993, 1.3043-1.3049. When the price moves 20 pips in the right direction after opening a trade, a stop loss can be set at breakeven. On Wednesday, no important events lined up in the UK. The US will finally release its highly anticipated inflation data. This can provoke absolutely any market reaction. Be prepared for any type of movement.
Basic trading rules:
1) The strength of the signal depends on the time period during which the signal was formed (a rebound or a break). The shorter this period, the stronger the signal.
2) If two or more trades were opened at some level following false signals, i.e. those signals that did not lead the price to Take Profit level or the nearest target levels, then any consequent signals near this level should be ignored.
3) During the flat trend, any currency pair may form a lot of false signals or do not produce any signals at all. In any case, the flat trend is not the best condition for trading.
4) Trades are opened in the time period between the beginning of the European session and until the middle of the American one when all deals should be closed manually.
5) We can pay attention to the MACD signals in the 30M time frame only if there is good volatility and a definite trend confirmed by a trend line or a trend channel.
6) If two key levels are too close to each other (about 5-15 pips), then this is a support or resistance area.
How to read charts:
Support and Resistance price levels can serve as targets when buying or selling. You can place Take Profit levels near them.
Red lines are channels or trend lines that display the current trend and show which direction is better to trade.
MACD indicator (14,22,3) is a histogram and a signal line showing when it is better to enter the market when they cross. This indicator is better to be used in combination with trend channels or trend lines.
Important speeches and reports that are always reflected in the economic calendars can greatly influence the movement of a currency pair. Therefore, during such events, it is recommended to trade as carefully as possible or exit the market in order to avoid a sharp price reversal against the previous movement.
Beginners should remember that every trade cannot be profitable. The development of a reliable strategy and money management are the key to success in trading over a long period of time.