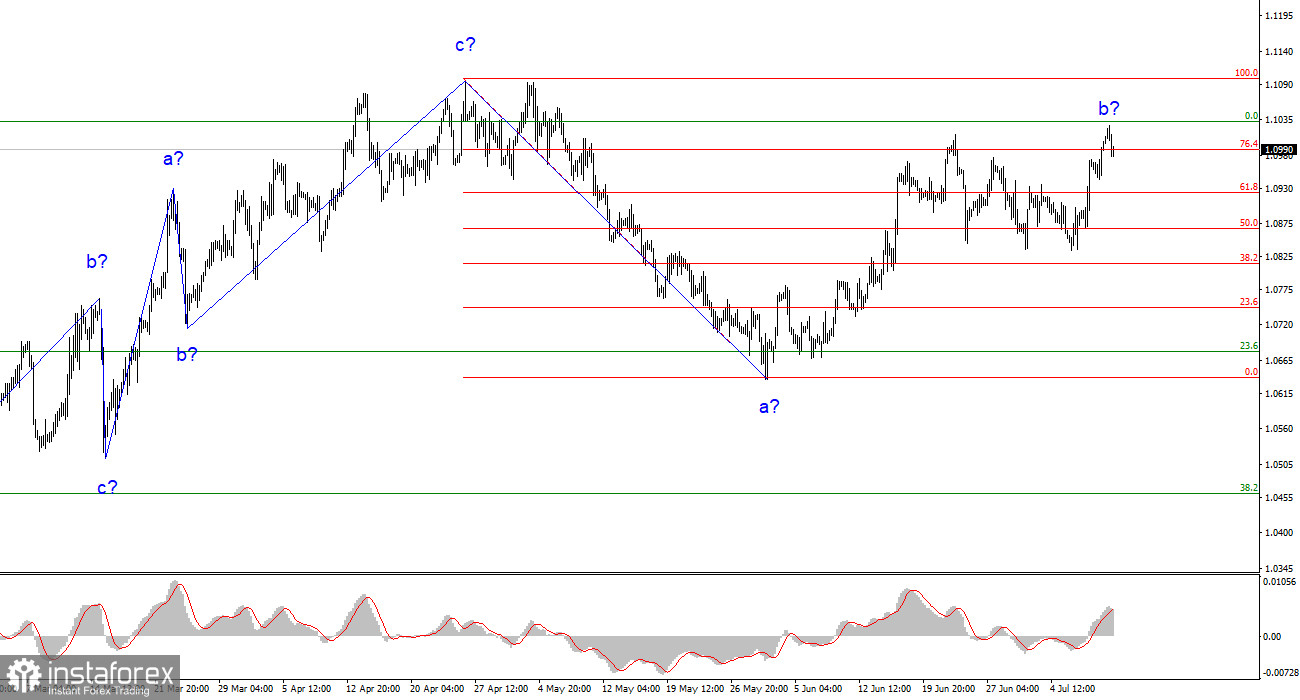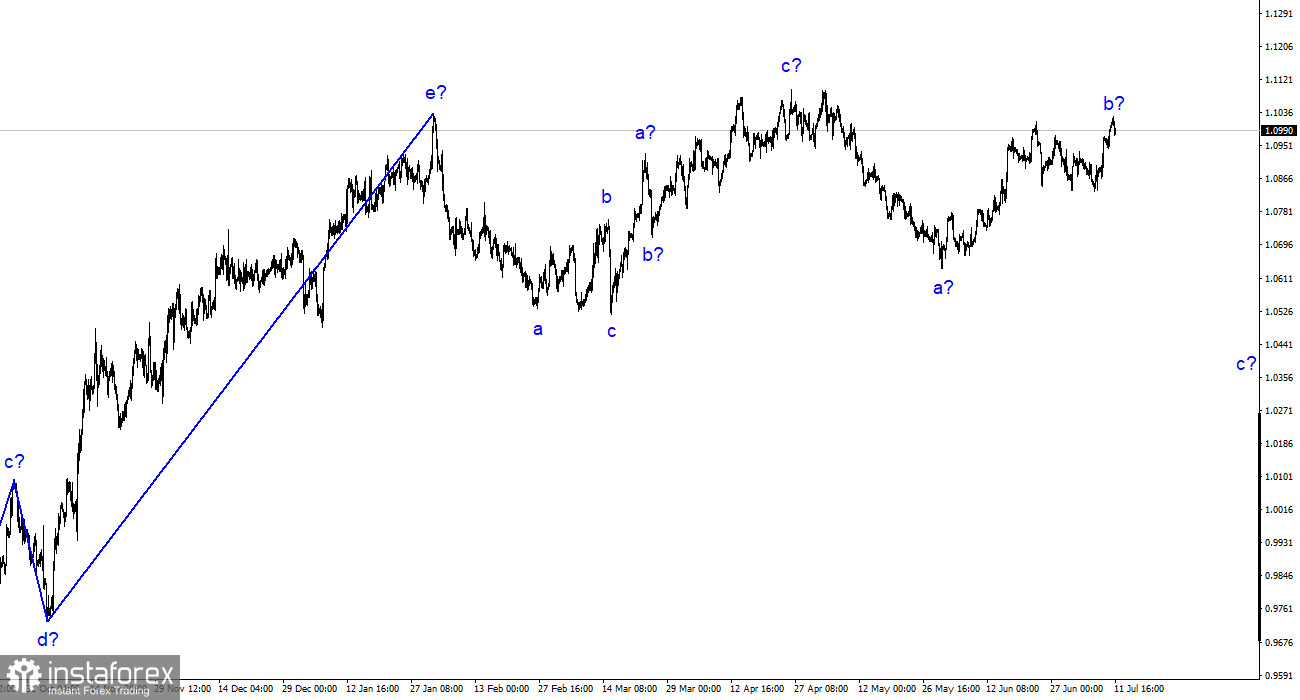
The wave analysis of the 4-hour chart for the euro/dollar pair continues to be not quite standard but still needs clarification. The trend's entire ascending section, which started on March 15, may take on a more complex structure, but at this time, I expect to construct a descending segment of the trend, which will likely also be a three-wave. Recently, I have repeatedly said that I am waiting for the pair around the 5th figure, where the formation of an ascending three-wave once started. So far, I am not backing down from my words. The assumed wave b is becoming more complicated but can complete its formation at any moment. Today the last peak of the pair was updated, so wave b got a more elongated look.
However, in light of recent events and especially the movements of the GBP/USD pair, there is an alternative wave analysis available, which assumes that the entire section of the trend between March 15 and April 26 is one wave a. If this is indeed the case, the next wave is b, and we are now seeing the formation of an ascending wave c. In this case, the wave analysis of the pound and the euro coincide, and everything falls into place. If this assumption is correct, the European will continue to rise to the 11th figure and higher from the current positions.
Reports from the European Union are also discouraging
The euro/dollar pair rate increased by 35 basis points on Monday and decreased by 10 today. The amplitude of the pair was much higher than it might seem at first glance, but it still cannot be called high. This morning, the market received disappointing news that did not allow it to continue buying. Inflation in Germany rose from 6.1% y/y to 6.4% y/y. The harmonized consumer price index rose from 6.3% to 6.8%. The economic sentiment index in the European Union fell from -10 to -12.2. The economic sentiment index in Germany fell from -8.5 to -14.7. Therefore, three European reports were weak, so the subsequent decline in demand for the euro is not surprising.
The latest economic statistics from America also disappointed me to some extent. The data was not so bad that the dollar would drop 1 cent. Now many analysts are trying their best to "find" ambiguity in the numbers to explain the next fall of the dollar somehow. Wave analysis allows for a new downward wave from current levels, but demand for the dollar should be growing, not falling. But the US currency is only falling, although some reports from the European Union are no better, as today showed. However, the market now selectively responds to economic data, showing that its mood is more important than reports.
General Conclusions.
Based on the analysis, the formation of the downward trend segment continues. The pair has quite a large room for decrease. I still believe that targets in the range of 1.0500-1.0600 are quite realistic, and with these targets, I advise selling the pair on MACD "down" signals. The assumed wave b could end soon and has now taken a three-wave form. With alternative analysis, the ascending wave will be longer and more complicated, but in this case, its length can be virtually any.
At the larger wave scale, the wave analysis of the ascending trend segment has taken an elongated form but is probably complete. We have seen five waves up, which most likely constitute the structure of a-b-c-d-e. The pair then built two three-wave patterns: down and up. It is likely in the stage of building another descending three-wave structure.
 English
 Русский
 Bahasa Indonesia
 Bahasa Malay
 ไทย
ไทย Español
 Deutsch
 Български
 Français
 Tiếng Việt
 中文
中文 বাংলা
বাংলা हिन्दी
 Čeština
 Українська
 Română


