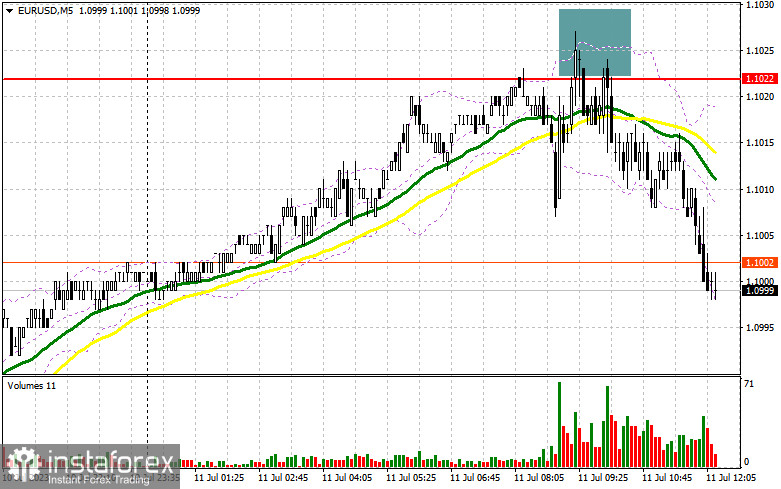
In my morning forecast, I drew attention to the 1.1022 level and recommended making decisions about entering the market from it. Let's look at the 5-minute chart and figure out what happened there. The rise and formation of a false breakout at this level allowed a sell signal for the euro, resulting in a drop of more than 25 points. Nothing was revised for the second half of the day from a technical point of view, as was the action plan.

To open long positions on EUR/USD:
Very weak data from ZEW on Germany and the eurozone, as well as German inflation, which matched economists' forecasts - all this limited the upward potential of EUR/USD in the first half of the day, providing an excellent entry point for selling the euro, which is still valid at the time of writing the article. Nothing in the day's second half could significantly help the dollar, so a re-attack of monthly highs should be included. Figures from the NFIB Small Business Optimism Index and a speech by FOMC member James Bullard will be mediocre.
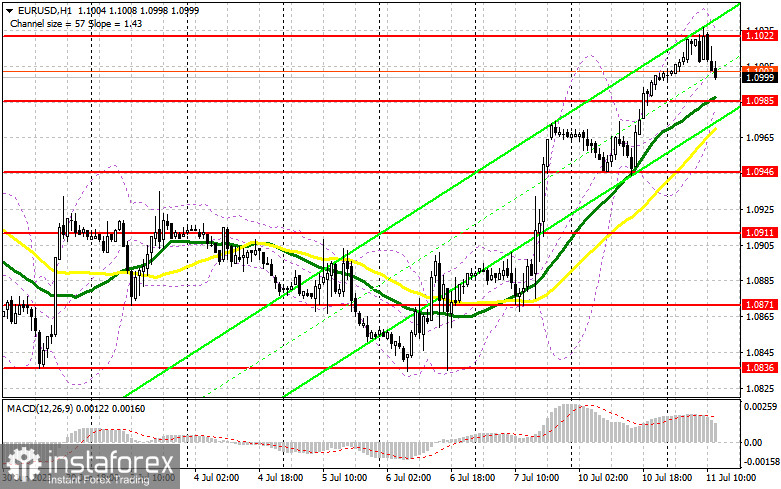
For this reason, I prefer to act in the support area of 1.0985, formed as a result of yesterday. The formation of a false breakout there will give a buy signal, allowing it to return to the rather large resistance of 1.1022, which was not possible to break through in the first half of the day. A breakthrough and a top-down test of this range will strengthen the demand for the euro, giving it a chance to reach 1.1053. The farthest target remains the area of 1.1090, which will indicate the construction of a new upward trend for the euro. There I will fix the profit. In case of a decrease in EUR/USD and the absence of buyers at 1.0985 during the American session, where the moving averages that play on the side of the bulls pass, bears may begin to act more actively to build a downward correction. Therefore, only the formation of a false breakout in the area of the next support of 1.0946 will give a signal to buy the euro. I will open long positions immediately on a rebound from the minimum of 1.0911, with the target of an upward correction of 30-35 points within the day.
To open short positions on EUR/USD requires:
Sellers have indicated that no one intends to relinquish market control without being forced to do so. As long as trading continues below 1.1022, further decline in the pair can be expected, and the subsequent formation of a false breakout there after US statistics are released will serve as evidence of the presence of major players in the market. This will also give a sell signal with the prospect of reducing EUR/USD to the support level of 1.0985. Fixing below this range and a reverse test from bottom to top is a direct path to 1.0946. The farthest target will be a minimum of 1.0911, where I will fix the profit. In the event of an upward movement of EUR/USD during the American session and the absence of bears at 1.1022, which is most likely to happen, as this level has already worked itself out, the situation will remain under the control of the buyers. In this case, I will postpone short positions until the next resistance at 1.1053. You can also sell there, but only after unsuccessful fixing. I will open short positions immediately on a rebound from the maximum of 1.1090 with the aim of a downward correction of 30-35 points.


Indicator signals:
Moving Averages
Trading above 30 and 50-day moving averages indicate further pair growth.
Note: The author considers the period and prices of moving averages on the H1 hourly chart and differ from the general definition of classic daily moving averages on the D1 daily chart.
Bollinger Bands
In case of growth, the upper border of the indicator in the area of 1.0972 will serve as resistance.
Indicator Descriptions
• Moving average (defines the current trend by smoothing volatility and noise). Period 50. Marked in yellow on the chart.
• Moving average (defines the current trend by smoothing volatility and noise). Period 30. Marked in green on the chart.
• MACD Indicator (Moving Average Convergence/Divergence - convergence/divergence of moving averages) Fast EMA period 12. Slow EMA period 26. SMA period 9.
• Bollinger Bands. Period 20
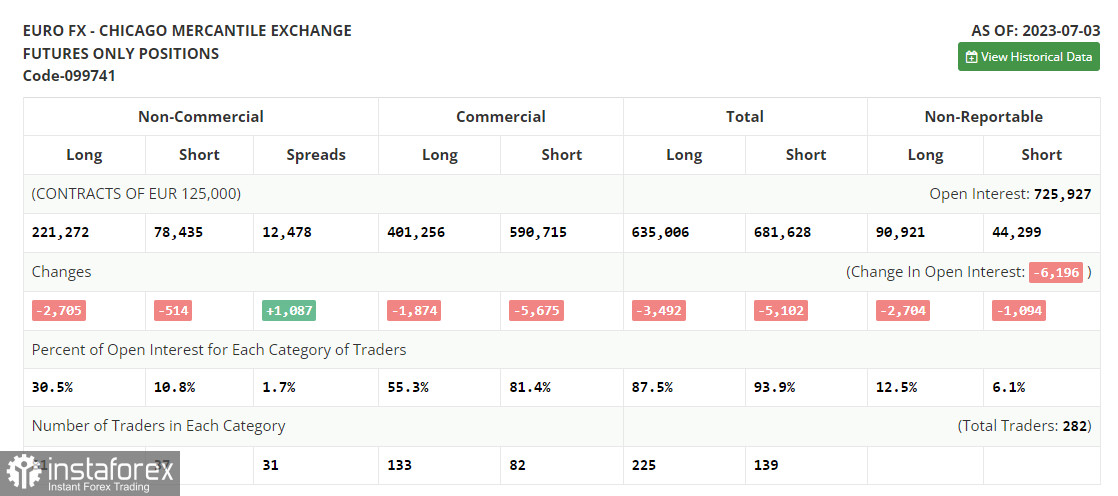
• Non-commercial traders - speculators, such as individual traders, hedge funds, and large institutions, using the futures market for speculative purposes and meeting certain requirements.
• Long non-commercial positions represent the total open long position of non-commercial traders.
• Short non-commercial positions represent the total open short position of non-commercial traders.
• The total non-commercial net position is the difference between non-commercial traders' short and long positions.
 English
 Русский
 Bahasa Indonesia
 Bahasa Malay
 ไทย
ไทย Español
 Deutsch
 Български
 Français
 Tiếng Việt
 中文
中文 বাংলা
বাংলা हिन्दी
 Čeština
 Українська
 Română

