 English
  Русский
 Bahasa Indonesia
 Bahasa Malay
 ไทย
ไทย Español
 Deutsch
 Български
 Français
 Tiếng Việt
 中文
中文 বাংলা
বাংলা हिन्दी
 Čeština
 Українська
 Română

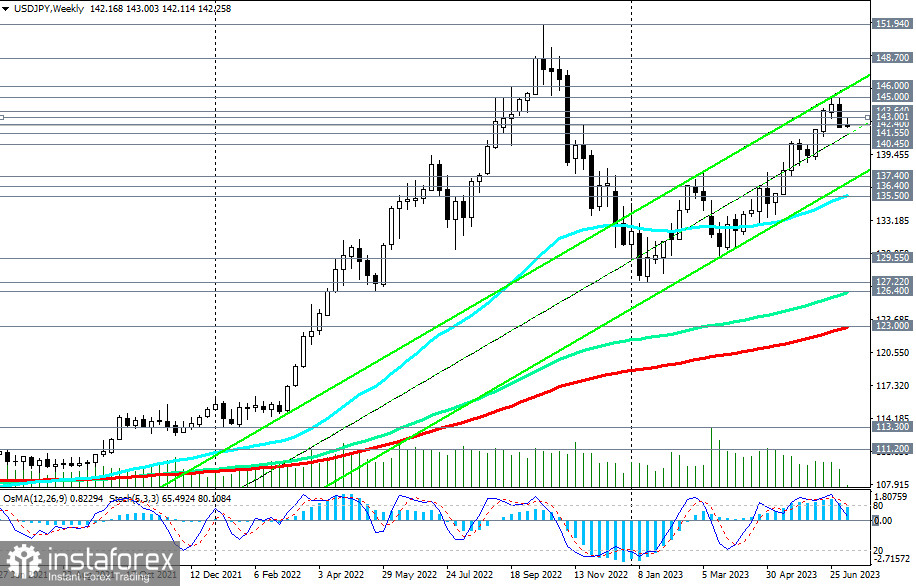
Considering the weak macroeconomic data coming from Japan and the relatively low inflation pressure, we should not expect a change in the course of the Bank of Japan's ultra-loose monetary policy. At the same time, the Federal Reserve leaders seem seriously intent on sticking to a tight monetary policy. This factor promotes dollar purchases at the expense of a cheaper yen, according to the so-called carry-trade strategy, and the maintenance of the bullish trend of USD/JPY.
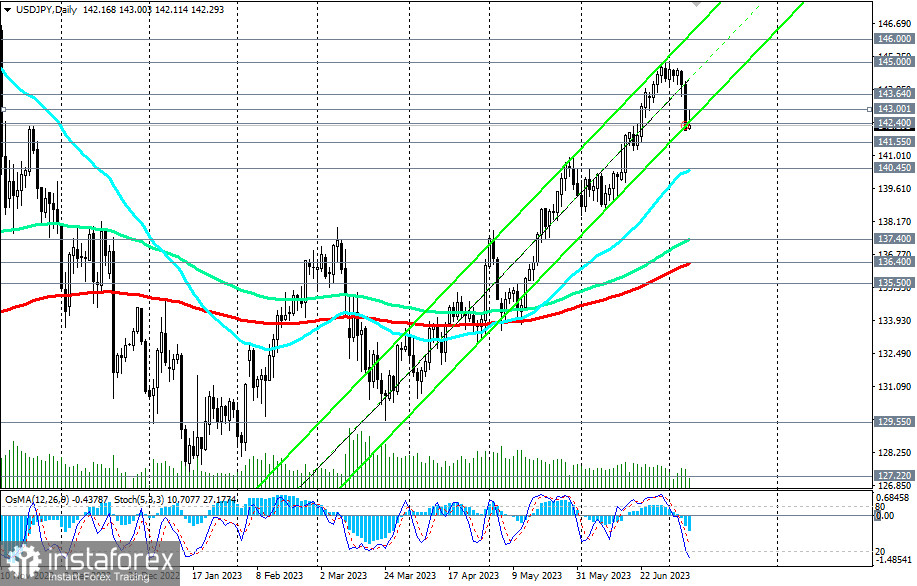
Despite the decline last week, USD/JPY continues to move within ascending channels on the daily and weekly charts, in the bullish market zone - medium-term, above key support levels of 137.40 (144 EMA on the daily chart), 136.40 (200 EMA on the daily chart), long-term, above key support levels of 126.40 (144 EMA on the weekly chart), 123.00 (200 EMA on the weekly chart), and global (above the key support level of 111.00).
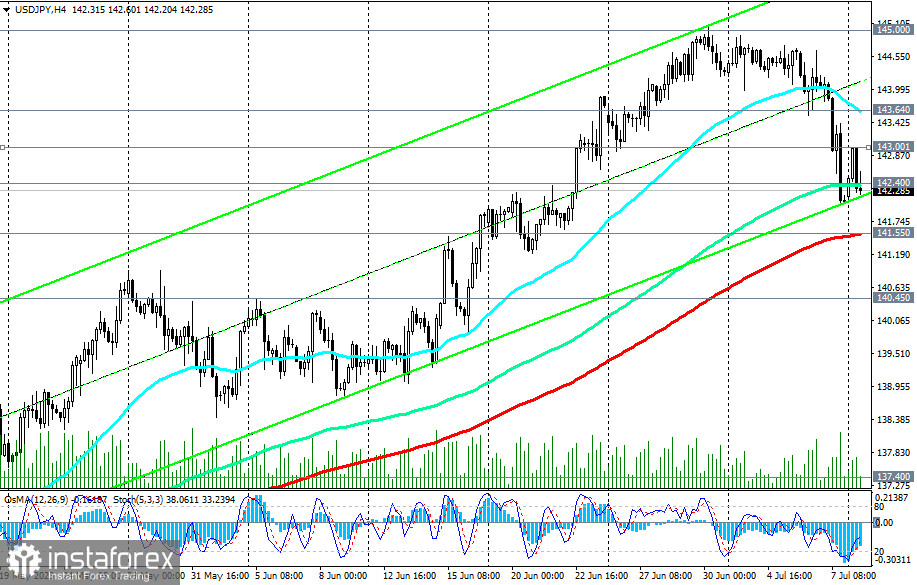
Therefore, in our opinion, it would be appropriate to open new long positions near the support levels of 142.40 (144 EMA on the 4-hour chart), 142.00, 141.50 (200 EMA on the 4-hour chart), as well as when the price drops to the support levels of 141.00, 140.45 (50 EMA on the daily chart).
A break above the resistance levels of 143.00, 143.64 (200 EMA on the 1-hour chart) will confirm our assumption.
Only a break below the support level of 136.40 will put the medium-term bullish trend at risk, and a break of the support level of 123.00 will affect the long-term trend of USD/JPY.
In the alternative scenario, the price will still break through the mentioned support levels and head inside the ascending channel on the weekly chart to the support levels of 137.40, 137.00, 136.40, 136.00, 135.50.
Therefore, if this scenario is the basis, then a break of the 141.50 support level will be a signal for increasing (or opening) short positions (in this case, we set the restrictive Stop-loss above the mark of 142.60).
If the decline continues, breaking the key support level of 123.00 (200 EMA on the weekly chart), USD/JPY will be in a long-term bear market zone.
Support levels: 142.40, 142.00, 141.55, 141.00, 140.45, 140.00, 137.40, 136.40, 135.50, 129.55, 127.20, 126.40, 123.00
Resistance levels: 143.00, 143.64, 144.00, 145.00, 146.00, 148.70